Yesterday Wolfgang Münchau wrote an article in the Financial Times The Bundesbank has no right at all to be baffled in which he gave his opinion about Bundesbank President Jens Weidmann’s leaked letter to the European Central Bank President Mario Draghi expressing concerns on the Bundesbank’s TARGET2 assets.
According to the Bundesbank December 2011 Monthly Report, its claims on the rest of the Eurosystem was around €476bn (and that it reduced somewhat in December!)

According to Münchau,
The Bundesbank initially dismissed the Target 2 balance as a matter of statistics. Their argument was: yes, it is recorded in the Bundesbank’s accounts, but the counterparty risk is divided among all members according to their share in the system. But last week, Jens Weidmann, president of the Bundesbank, acknowledged the Target 2 imbalances are indeed important, and an unacceptable risk. The Bundesbank has now joined the united front of German academic opinion.
and that:
One would assume that the best policies would be those that attack the root of the problem – the imbalances themselves. One of the deep causes behind this problem is, of course, Germany’s persistent current account surplus. The problem can thus easily be solved through policies to encourage Germany to raise its imports relative to its exports. You need policies that provide eurozone-wide backstops to the banking sector, and also policies to insure against asymmetric shocks. And you need to harmonise many aspects of structural policy to ensure imbalances do not become entrenched.
But there is no appetite for any of this in Germany. Instead, the Bundesbank prefers to solve the problem by addressing the funding side. Mr Weidmann proposed last week that Germany’s Target 2 claims should be securitised. Just think about this for a second. He demands contingent access to Greek and Spanish property and other assets to a value of €500bn in case the eurozone should collapse. He might as well have suggested sending in the Luftwaffe to solve the eurozone crisis. The proposal is unbelievably extreme.
This is indeed extreme but there are ones who argue that the Bundesbank’s (approximately) €476bn TARGET2 assets do not matter much – because the Bundesbank being the issuer of settlement balances of banks cannot go broke. This is from the Irish Economy Blog:
First, every national central bank in the Eurosystem currently has assets that exceed their liabilities and total Target2 credits equal Target2 liabilities. Thus, the most likely resolution of Target imbalances in the case of a full Euro breakup would be a pooling of assets held by Target2 debtors to be handed over to Target2 creditors to settle the balance. This may leave the Bundesbank holding a set of peripheral- originated assets that may be worth less that face value but this scenario would result in losses to the Bundesbank that would be far short of the current value of its Target2 credit.
Second, as Gavyn Davies discusses in this interesting FT article, central bank balance sheets are simply not the same as normal private sector balance sheets. It is unwise for central banks to go around printing money to purchase worthless assets so it is generally appropriate to insist that a central bank’s assets at least equal the value of the money it has created.
That said, should the Bundesbank end of losing a bunch of money because its Target2 credit was worth less than stated, there would be no earthly reason why the German public would need to give up large amounts of money to ensure that the Bundesbank remained “solvent”.
In a post-euro world, the Bundesbank would be one of a select number of central banks that could be counted on to print a currency likely to retain its value. Weidmann could write himself a cheque, stick it in the vaults and declare the Bundesbank to be solvent without any need to call on the German taxpayer.
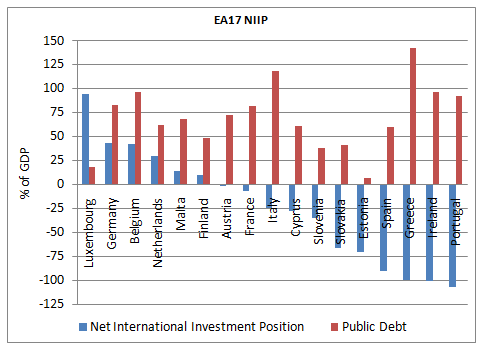
I had written on this sometime back in the post Who is Germany? so I refer the reader to the post. Briefly my argument is that the TARGET2 balance is an important item in Germany’s International Investment Position. If there is a breakup of the Euro Area, then Germany’s wealth reduces. Indeed Karl Whelan has somewhat changed his position – from arguing it doesn’t matter to arguing that there will be a demand for settlement!
Matters can get worse in case there is a dreadful scenario in which the financial firms do a panic selling of assets in the Euro Area but held outside Germany and make a “flight to quality” to Germany. This by itself does not change Germany’s net international position (only gross items in IIP) but if the breakup results in a default by the “periphery”, Germany’s wealth erodes (among other assets, TARGET2 claims vanish overnight) and it can become a net debtor of the rest of the world from being a net creditor!
National Balance Sheet
In one of my recent posts, I went into the concept of “National Saving”. The stock counterpart of this is the “Net Worth”. It is calculated by first taking the nonfinancial assets within a nation’s boundary (defined appropriately on what is counted and what is not). Then one adds financial assets and liabilities. The claims within sectors of an economy cancel out because every asset has a counterpart liability and one is left with assets and liabilities with the rest of the world.
This is the SNA concept of net worth. It is done for example for the case of Australia in the following manner by the Australian Bureau of Statistics. (Link to the full release Australian System of National Accounts 2010-11)
")
")
So if a nation’s external assets are impaired for whatever reason, its wealth reduces. It doesn’t matter if it is the central bank whose assets are impaired. This is counter-intuitive because no sector immediately may “feel the pinch” due to the central bank’s loss of assets held abroad.
That’s a bit of Mercantilism. It is true that Mercantilist policies “injures everyone alike” as argued by Keynes himself and later by many Post Keynesians (such as Basil Moore whom I quoted in this post). However, it cannot be argued that a potential asset impairment of the Bundesbank’s TARGET2 balance does not cost the German taxpayer. So the Bundesbank would indeed go behind debtor nations and ask them to settle claims!
Needless to say, this is no defense of Weidmann’s position!
Recycling Old Posts
Here are some related posts on basics of TARGET2 and the Eurosystem: The Eurosystem: Part 1, Part 2, Part 3, Part 4, & Part 5.