The recent cover story of The Economist on Germany’s trade surpluses—titled The German Problem: Why Germany’s Current-Account Surplus Is Bad For The World Economy— is the biggest concession the magazine has made to Keynesianism. Of course, it’s not as if the publication is now a full Keynesian but still, it’s a large admission.
I have two previous posts on this:
So it was expected that The Economist‘s story was going to be opposed by other publications pandering to the establishment. For example, FT‘s Martin Sandbu who wrote a piece, Germany Bashing Falls Flat.
Handelsblatt had this response:
Sandbu’s main point is:
That means the accusation against Germany comes about five years too late. There was indeed a strong jump in the nation’s trade surplus half a decade ago, at a time when the world was still struggling to come out of recession. But that surplus has not changed much since.
He also says:
[the] claim [that Germany’s penchant for high saving … is a drag on global growth] trips up both analytically and contextually. Analytically, because the impulse from net trade on aggregate demand is the change in the external balance, rather than its level — much like the impulse from a fiscal deficit is the change in public borrowing as a share of economic output. So long as imports, exports and other macroeconomic aggregates grow at the same rate, a stable external balance goes along with the same steady growth of aggregate demand.
This claim has a pretense to be analytical but it’s hardly the case. This can be seen in stock-flow consistent models but it’s not the easiest to show that in a blog post, so here’s an attempt:
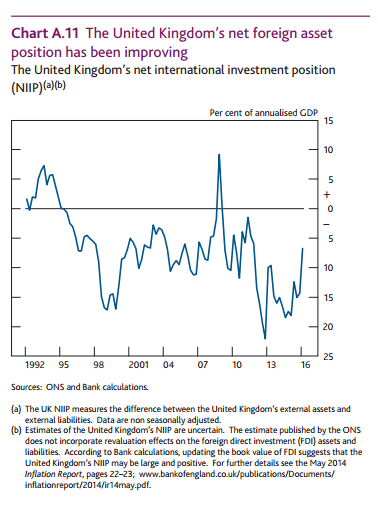
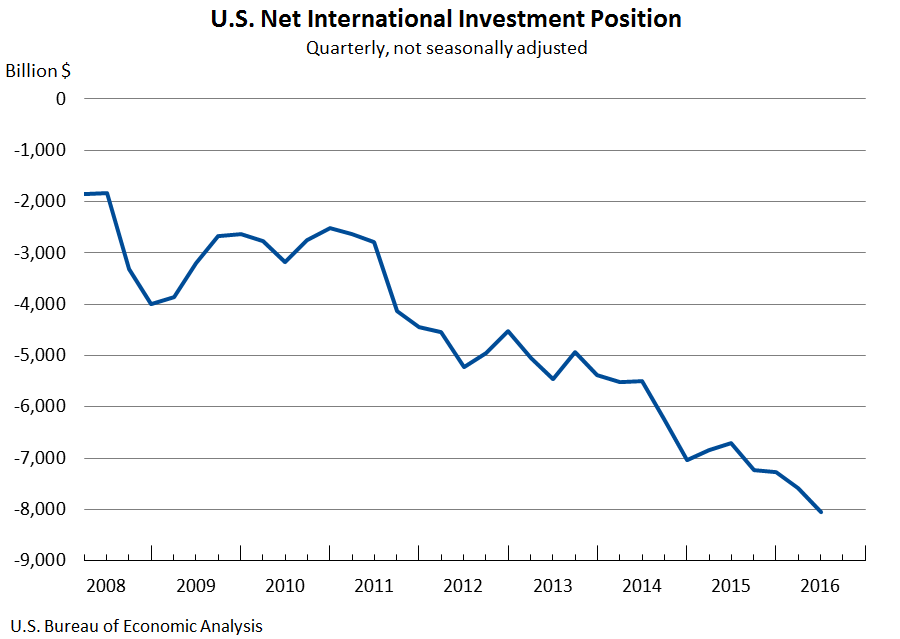
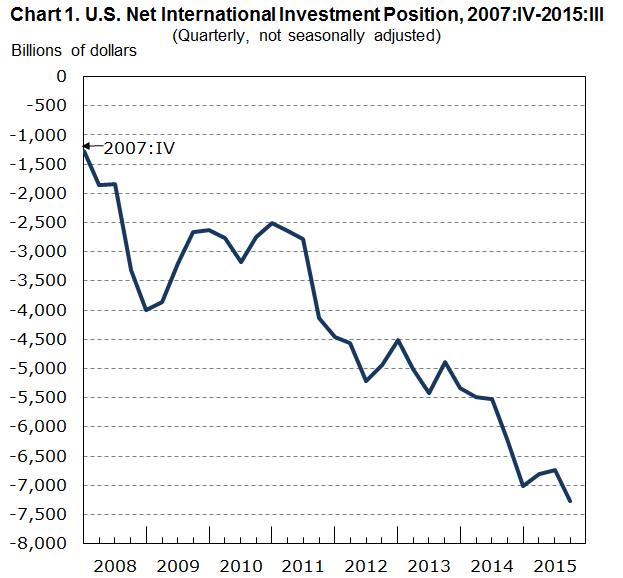
Divide the world into Germany (and other surplus countries) and the rest of the world. The rest of the world’s current account deficit means (without minor qualifications about “revaluations”) that its net international investment position is deteriorating by the amount of its current account deficit. So it’s not the case that if some aggregates grow at some rate, everything is fine because others—such as NIIP/GDP—aren’t.
There are many debt sustainability conditions and each should be used with care. One condition is that
cad(g) < g
where the lowercase cad is the ratio CAD/GDP, CAD is the current account deficit and g is the growth rate of GDP. It’s not as simple as it looks, because growth rate of GDP also affects the current account balance or deficit. The notation cad(g) is to indicate that it is so.
For high growth rates, cad(g) is larger than g.
In other words, sustainability implies that growth is restricted to be low.
Similarly, on the creditor’s side, an economy (i.e., Germany) growing at about 2.2% (nominal) and current account balance of 8.3%, that implies that its NIIP/GDP is rising fast (and hence deteriorating the ratio of others).
So Sandbu’s claim that those asking Germany to expand domestic demand aren’t analytical itself falls flat. His analysis just does a chart eyeballing of some numbers. Just because a few things aren’t worsening, doesn’t mean things are fine. Other metrics may be worsening.
Handelsblatt‘s analysis doesn’t really say much except claiming that Germany’s trade surplus just means its expenditure is less than its income and nothing more. It also errs on endorsing the claim that, “that national economies cannot be managed like large firms.”, which the crisis taught us is highly incorrect.