Thirlwall’s Law is counter-intuitive and comes across as shocking. It says that the growth of a nation’s economy is directly proportional to the rate of exports and inversely related to the income elasticity of imports.
The reason it comes as shocking and difficult to believe is that our planet, with all inhabitants and institutions considered resident cannot export (unless there are non-residents such as aliens), but the world still grows.
Now there are several pitfalls in this argument. First, Thirlwall’s law doesn’t fail because the expression for growth rate is indeterminate. Rate of exports is indeterminate and the income elasticity of imports is indeterminate.
So we have
growth = inderminate/indeterminate
Second, the world does not have a central government. So the world as a whole is not comparable to a closed economy with a government.
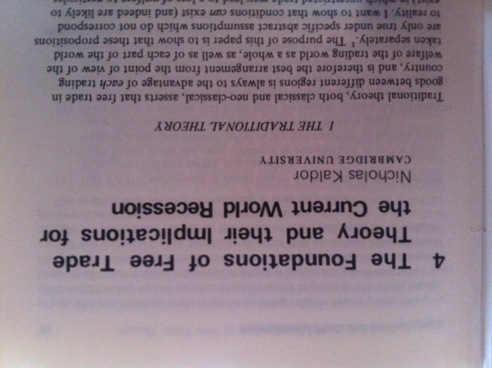
There is a way in which the world as a whole is balance-of-payments constrained. The argument is by Nicholas Kaldor. In his 1980 article Foundations And Implications Of Free Trade Theory, written in Unemployment In Western Countries – Proceedings Of A Conference Held By The International Economics Association At Bischenberg, France, Kaldor makes the argument for the world balance-of-payments constraint.
Nicholas Kaldor on free trade
In a recent article on the ‘Causes of Growth and Recession in World Trade’,1 T. F. Cripps has demonstrated that a country is not ‘balance of payments constrained’ if its full employment imports, M*, are less that its import capacity M̅ (as determined by its earning from exports). Such a country is free to choose the level of domestic demand which it considers optimal for its own circumstances,2 whereas the other countries from whom M* > M̅, must, under conditions of free trade, reduce their output and employment below the full employment level, and import only what they can afford to finance. He then shows that the sum of imports of the ‘unconstrained’ countries determine the attainable level of production and employment of the ‘constrained’ countries, and the remedy for this situation requires measures that increase the level of ‘full-employment’ imports or else reduce the export share of the ‘unconstrained countries’. The ‘rules of the game’ which would be capable of securing growth and stability in international trade, and of restoring the production of the ‘constrained’ countries to full employment levels, may require discriminatory measure of import control, of the type envisaged in the famous ‘scarce currency clause’ of the Bretton Woods agreement.
In the absence of such measures all countries may suffer a slower rate of growth and a lower level of output and employment, and not only the group of countries whose economic activity is ‘balance-of-payments constrained’. This is because the ‘surplus’ countries’ own exports will be lower with the shrinkage of world trade, and they may not offset this (or not adequately) by domestic reflationary measures so that their imports will also be lower. Provided that the import regulations introduced relate to import propensities (i.e. to the relation of imports to domestic output) and not to the absolute level of imports as such, the very fact that such measures will raise the trade, production and employment of the ‘constrained’ countries will mean that the volume of exports and domestic income of the ‘unconstrained’ countries will also be greater, despite the downward change in their share of world exports.3
2Owing to the widespread view according to which a given increase in effective demand is more ‘inflationary’ in its consequences if brought about by budgetary measure than if it is the result of additional investment or exports (irrespective of any limitations of import capacity) the inequality or potential inequality in its payments balance may cause a surplus country to regard a lower level of domestic demand as ‘optimal’ in the first case than in the second case.
3In other words, if countries whose ‘full employment’ balance of payments shows a surplus because M* < α W (where M* is the level of full employment imports, α is the share of a particular country’s exports of in world trade W) after a reduction of α to α̂ (α̂ < α) through the imposition of discriminatory measures, the country will still be better off if α̂ W* > α W where W* is the volume of world trade generated under full employment conditions.
[boldening mine]
What Kaldor is saying that because of balance of payments constraint of economies, the world as a whole has a slower growth because surplus nations do not expand domestic demand to the level needed. He is also saying that import controls raise imports rather than reduce them (this because of higher national income) and the exporters’ exports will also increase (even though their share is reducing.).
So the world as an built-in deflationary bias in the way it works.
I came across the UN Global Policy Model document with lots of equations and written by Francis Cripps and Alex Izurieta. (h/t Jo Michell). The article date is May 2014.
Just thought I should link it for readers interested.
From United Nations’ Conference on Trade and Development (UNCTAD)’s 2015 report, page 44:
… exposure to unregulated and large financial flows alters macroeconomic developments in ways that can lead to a slowdown of GDP growth as well as unstable internal dynamics marked by sudden shifts of income and wealth between the main sectors (private, public and external). A convenient way to map these shifts and their relationship with economic growth is by using the “demand stances” framework (see Godley and Cripps, 1983; Godley and McCarthy, 1998; and Taylor, 2001 and 2006). This framework reasserts the Keynesian principle that sustained growth requires continuously increasing injections (which, in simple macroeconomic terms, include private investment, government expenditure and exports) into the flow of income. These injections, in turn, require a steady growth of leakages (measured by the propensity to save, the tax rate and the import propensity), which over time ensure financial stability, as credit rises along the circular flow of income. Thus GDP growth can be explained as the growth, along stable norms, of injections relative to leakages; these eventually determine financial transfers between the main sectors. Such ratios of injections to leakages are termed stances and provide a measure both of demand drivers and financial balances.
[endnote:
In mathematical terms, the main accounting identity defines GDP as the sum of consumption (C), private investment (I), government expenditure (G) and exports(X) minus imports(M). Simple assumptions allow specifying the tax rate (t) and the savings and import propensities, s and m respectively, as: T = t · GDP; S = s · GDP; M = m · GDP, where T stands for total tax revenue and S for private savings. Arrangements of these equations around the accounting identity yield the expression: GDP = (G + I + X)/(t + s + m), or alternatively: GDP = wt · (G/t) + ws · (I/s) + wm · (X/m) where wt , ws and wm are the weights of each of the leakages (tax, savings and import propensities, respectively). This equation establishes that growth of GDP depends on the growth of the three variables, G/t, I/s and X/m; defined as fiscal stance, private stance and external sector stance, respectively, amplified by the strength of the respective multipliers, given the mentioned weights, in the macroeconomic context. To avoid complicating the presentation with derivation of the steady state conditions, it is sufficient to note that these stances reflect financial conditions as well, where a larger numerator than the denominator points towards a net borrowing position. Thus, a steady path of sustained growth and financial stability requires that none of these stances grow at a proportionally faster pace than the others for a prolonged period of time.
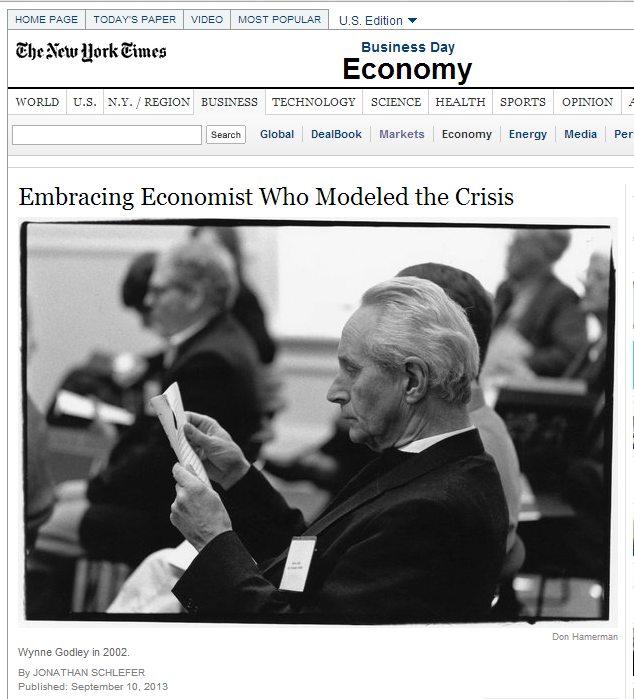
There’s a nice new article on Wynne Godley today in The New York Times.
An interesting thing in the article is the mention of intuition via models while mentioning his book Monetary Economics.
Why does a model matter? It explicitly details an economist’s thinking, Dr. Bezemer says. Other economists can use it. They cannot so easily clone intuition.
That is so right. The models in the books of Wynne Godley – both Monetary Economics with Marc Lavoie and Macroeconomics with Francis Cripps give a good idea about the authors’ intuitions. Of course, needless to say the man was bigger than his models.
A lot of heterodox economists are sympathetic to Paul Krugman because he seems to have argued for fiscal expansion.
Ha!
First, we are in this mess because of people like Paul Krugman who has promoted free trade – which has been destructive to the world economy as a whole and has prevented debtor nations from engaging in fiscal expansion to reflate their economies. The creditor nations won’t reflate their economies by fiscal expansion so easily – just barely the minimal needed to prevent social tensions from building up – because they don’t want to become debtors down the road. They overdo this but free trade has created this situation in the first place.
This crisis has made nations realize the importance of exports in growth and nations will want to improve their international investment position should there be growth in the rest of the world and they will want to wait sufficiently for exports to improve before expanding domestic demand. This creates a game theory like problem for growth of the world as a whole.
Now, Krugman is a smart man. He will make it look as if he was not all that dogmatic. And now ridicules everyone who opposes fiscal expansion. While it is good in a sense because the world needs a worldwide fiscal expansion (but this needs to be coordinated at least), it is nowhere close to the simplistic solutions Krugman presents with his comical IS/LM diagrams and liquidity trap theories and confusions with his notions of exogenous money – which is only a smart way of defending his earlier positions – even though we hear frequent Mea Culpas on his blog.
I came across this article by William Greider – Why Paul Krugman Is So Wrong in which he reminds the readers of how the mania of free trade has been promoted by Paul Krugman and how he has ridiculed everyone showing dissent.
It is generally nice in parts and is worth reading. I like the part in which Greider says that even though free trade has created problems for the United States, it wants to get out of the problems by promoting more free trade!
I am also reminded of a sacred tenet article of Paul Krugman making the case for free trade. The article titled Ricardo’s Difficult Idea not only ridicules anyone arguing against free trade but also gives out strategies on how to promote it.
Here is one paragraph which is worth quoting:
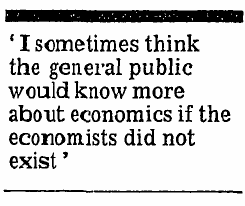
During the NAFTA debates I shared a podium with an experienced, highly regarded U.S. trade negotiator, a strong NAFTA suppporter [sic]. At one point a member of the audience asked me what I thought the effect of NAFTA would be on the number of jobs in the United States; when I replied “none”, based on the standard arguments, the trade official exploded in anger: “It’s remarks like that which explain why people hate economists!”
I like this quote by Francis Cripps from an article in The Guardian from 27 Feb 1979: Economists With A Mission:
I thought I should share what I found recently about who was to state the sectoral balances identity first – since it comes across as enlightening to say the least. I found the identity in Nicholas Kaldor’s 1944 article Quantitative Aspects Of The Full Employment Problem In Britain. It was published as Appendix C to Full Employment In A Free Societyby William Beveridge.
(If you find the mention of this identity anywhere before, please let me know!)
Here’s a Google Books screenshot of the page:
The article also appears in Kaldor’s Collected Essays, Vol 3 (Chapter 2, pp. 23-82).
The ‘net’ is net of consumption of fixed capital. Also ‘balance of payments’ is used for the current balance (footnote 1, page 28). (In TheScourge Of Monetarism, Kaldor used ‘net saving’ as saving net of investment).
Anthony Thirlwall wrote a biography of Kaldor in 1987 and he mentions that Kaldor kept pushing the implications of the identity in the 1960s (page 251). He managed to convinced some of his colleagues such as Wynne Godley and Francis Cripps and pick up public fights with others such as Richard Kahn.
Wynne Godley recalled how he came to appreciate this identity in his book Monetary Economics with Marc Lavoie. In Background Memories (W.G.) he wrote:
… In 1970 I moved to Cambridge, where, with Francis Cripps, I founded the Cambridge Economic Policy Group (CEPG). I remember a damascene moment when, in early 1974 (after playing round with concepts devised in conversation with Nicky Kaldor and Robert Neild), I first apprehended the strategic importance of the accounting identity which says that, measured at current prices, the government’s budget deficit less the current account deficit is equal, by definition, to private saving net of investment. Having always thought of the balance of trade as something which could only be analysed in terms of income and price elasticities together with real output movements at home and abroad, it came as a shock to discover that if only one knows what the budget deficit and private net saving are, it follows from that information alone, without any qualification whatever, exactly what the balance of payments must be. Francis Cripps and I set out the significance of this identity as a logical framework both for modelling the economy and for the formulation of policy in the London and Cambridge Economic Bulletin in January 1974 (Godley and Cripps 1974). We correctly predicted that the Heath Barber boom would go bust later in the year at a time when the National Institute was in full support of government policy and the London Business School (i.e. Jim Ball and Terry Burns) were conditionally recommending further reflation! We also predicted that inflation could exceed 20% if the unfortunate threshold (wage indexation) scheme really got going interactively. This was important because it was later claimed that inflation (which eventually reached 26%) was the consequence of the previous rise in the ‘money supply’, while others put it down to the rising pressure of demand the previous year …
He has a nice way of giving a short description of pricing in the G&L models:
In my view, the stock-flow and the demand driven (and I should say, the fact that price dynamics is orthogonal to the income flow determination structure) is the essential characteristic of this approach.
—
Also, Simon Wren-Lewis (from Oxford) has a new blog post on the sectoral balances approach – Sector Financial Balances As A Diagnostic Check, where he mentions Martin Wolf’s recent post on Wynne Godley’s approach. He (Wren-Lewis) has been admitting recently that DSGE models are not useful.
In the comments section Simon Wren-Lewis has this to say:
Martin Wolf sent me the following comment, which I am sure others will also find interesting:
“I used sectoral financial balances before the crisis, following Wynne. I argued that what was going on in the US external and household sectors were evidently unsustainable. This allowed me to argue that when the latter’s deficits were eliminated, there would be a recession and a huge fiscal deficit. What I had not expected was that the turnaround in the household sector would trigger a meltdown of the financial system.
“This makes it clear that one has to link the flow sectoral balances to the balance sheets in the economy. In this case, my mistake was not looking closely enough at the balance sheet of the financial sector. Good macroeconomic analysis has to examine the flows and stock meticulously and seek to assess whether the behaviour we see is sustainable. The assumption that private agents cannot make huge mistakes about the sustainability of what they are doing is, in my view, the biggest mistake in macroeconomics.”
Back to DSGE models. I think they are totally useless. I like this quote by Francis Cripps from an article in The Guardian from 27 Feb 1979: Economists With A Mission:
The crisis has a lot of connections with the way Macroeconomics was done in the 1970s and this interests me a lot. Of course the equally important reason was that Nicholas Kaldor and Wynne Godley were highly involved in the public discussions. Here are some books I collected which have special importance to the Cambridge Economic Policy Group (CEPG):
I could manage to only get used copies of the first two books.
The book has the paper New Cambridge Macroeconomics And Global Monetarism – Some Issues In The Conduct Of U.K. Economic Policy, by Martin Fetherston and Wynne Godley and comments by others such as Alan Blinder – which I mentioned in the post Debt Monetization. The book is also available from Wiley but you have to pay $500+ for it!
This one got the title right – it wasn’t Keynesianism versus Monetarism. It was New Cambridge versus Keynesianism versus Monetarism.
The following book by Peter Kenway was first published in 1994 but was republished recently because the crisis has deep roots with debates in the 1970s!
It has nice discussions about the various types of income/expenditure models of the 1970s in the UK with a lot on the CEPG. It gives nice lists of all models – some of them here (via amazon.com preview):
Here’s a short autobiography by Wynne Godley (written around 1999) on how he dissented from the profession. Here’s a Google Books preview from the book A Biographical Dictionary of Dissenting Economists edited by Philip Arestis and Malcolm C. Sawyer
click to view on Google Books
I like this:
… I had extraordinary difficulty in understanding, not the sentences, but what real life state of affairs mainstream ‘neoclassical’ macroeconomics could possibly be held to be describing. I went through the standard textbooks on macroeconomics and then back to the underlying professional literature (the locus classicus being, as I now see it, Modigliani. 1944 and 1963). I taught myself how to draw the diagrams and solve the equation systems, but for years could not make any connection between these and the real world as I knew it…
One of the things which made Godley dissenting was the proposal to control imports as the paper title suggests:
(click for link to the journal)
This was met with huge hostility as a Times article (from the late 70s) shows. Economists confused it as “selective protectionism”:
I got my copy of Monetary Economics by Wynne Godley and Marc Lavoie yesterday. I know some people were waiting for the second edition of the book, and had postponed their purchase to get the newer edition – so they can get it now!
There aren’t any changes in this edition – except for correction of some typos and that this edition is a paperback while the first one was hardcover. I already knew this as Marc Lavoie told me “don’t buy it” – but of course how can I not!
One thing I noticed is a nice summary by Wynne Godley which he wrote after the first edition was published.
Here’s an autograph from Marc Lavoie I got last year in May – live to tell!
I hope I live up to it 🙂
The first time I saw something called the Transactions Flow Matrix in a Levy Institute paper, I rushed to buy the book. When I started reading it, it became clear that nobody has ever come close to it! After a while – and solving the models on a computer gives one greater intuition – it slowly started becoming clear to me why so much effort has been put in.
Wynne Godley always wanted to write a textbook to help others understand Cambridge Keynesianism, as he often thought that while top economists from Cambridge knew how economies work together, they never attempted to share this knowledge. I think his aim was also to sharpen his own knowledge and to think of scenarios which one may not be able to foresee using simple arguments.
With this aim, he made a first attempt with his partner at “New Cambridge”, Francis Cripps.
I really like this from the book’s introduction:
… Our objective is most emphatically a practical one. To put it crudely, economics has got into an infernal muddle. This would be deplorable enough if the disorder was simply an academic matter. Unfortunately the confusion extends into the formation of economic policy itself. It has become pretty obvious that the governments of many countries, whatever their moral or political priorities, have no valid scientific rationale for their policies. Despite emphatic rhetoric they do not know what the consequences of their actions are going to be. Moreover, in a highly interdependent world system this confusion extends to the dealings of governments with one another who now have no rational basis for negotiation.
This was a great book but didn’t receive much attention except for a small group who thought (rightly!) it was a work of genius. He wanted to do more and so we see him mention in an article on him – praising his prescience on writing the fate of the British economy on the wall in the 70s and the 80s. Here’s from the Guardian:
… What I’m doing is abolishing economics as currently understood, conducting an enormous sanitary operation upon a very clogged profession. I’m going to push a dose of salts through that system. It is a ruthless application of logic and accountancy to macroeconomics.
(click to enlarge and click again)
When Wynne Godley lost the partnership of Francis Cripps (whom Wynne called the smartest Economist he ever met), he was forced to do a lot of things himself and probably felt somewhat alone. After writing some amazing papers in the 1990s, he needed someone like Cripps to write a book. Fortunately he met Marc Lavoie and they collabrated for many years in writing papers and articles and finally the book.
Marc Lavoie recalls the memories in this article from the Godley conference last year.
In the previous two posts, I went into a description of the transactions flow matrix and the balance sheet matrix as tools for an analytic study of a dynamical study of an economy.
During an accounting period, sectors in an economy are making all kinds of transactions. These can be divided into two kinds:
Income and Expenditure Flows
Financing Flows
Let’s have the transactions flow matrix as ready reference for the discussion below.
(Click for a nicer view in a new tab)
The matrix can easily be split into two – on top we have rows such as consumption, government expenditure and so on and in the bottom, we have items which have a “Δ” such as “Δ Loans” or “change in loans”. We shall call the former income and expenditure flows and the latter financing flows.
To get a better grip on the concept, let us describe household behaviour in an economy. Households receive wages (+WB) and dividends from production firms (called “firms” in the table) and banks (+FD_{f} and +FD_{b}) respectively) on their holdings of stock market equities. They also receive interest income from their bank deposits and government bills. These are sources of households’ income. While receiving income, they are paying taxes and consuming a part of their income (and wealth). They may also make other expenditure such as buying a house or a car. We call these income and expenditure flows.
Due to these decisions, they are either left with a surplus of funds or a deficit. Since we have clubbed all households into one sector, it is possible that some households are left with a surplus of funds and others are in deficit. Those who are in surplus, will allocate their funds into deposits, government bills and equities of production firms and banks. Those who are in deficit, will need funds and finance this by borrowing from the banking system. In addition, they may finance it by selling their existing holding of deposits, bills and equities. The rows with a “Δ” in the bottom part of transactions flow matrix capture these transactions. These flows will be called financing flows.
How do banks provide credit to households? Remember “loans make deposits”. See this thread Horizontalism for more on this.
This can be seen easily with the help of the transactions flow matrix!
The two tables are some modified version of tables from the book Monetary Economics by Wynne Godley and Marc Lavoie.
It is useful to define the flows NAFA, NIL and NL – Net Accumulation of Financial Assets, Net Incurrence of Liabilities and Net Lending, respectively.
If households’ income is higher than expenditure, they are net lenders to the rest of the world. The difference between income and expenditure is called Net Lending. If it is the other way around, they are net borrowers. We can use net borrowing or simply say that net lending is negative. Now, it’s possible and typically the case that if households are acquiring financial assets and incurring liabilities. So if their net lending is $10, it is possible they acquire financial assets worth $15 and borrow $5.
So the the identity relating the three flows is:
NL = NAFA – NIL
I have an example on this toward the end of this post.
I have kept the phrase “net” loosely defined, because it can be used in two senses. Also, some authors use NAFA when they actually mean NL – because previous system of accounts used this terminology as clarified by Claudio Dos Santos. I prefer old NAFA over NL, because it is suggestive of a dynamic, though the example at the end uses the 2008 SNA terminology.
While households acquire financial assets and incur liabilities, their balance sheets are changing. At the same time, they also see holding gains or losses in their portfolio of assets. What was still missing was a full integration matrix but that will be a topic for a post later. Since, it is important however, let me write a brief mnemonic:
where revaluations denotes holding gains or losses.
This is needed for all assets and liabilities and for all sectors and hence we need a full matrix.
We will discuss more on the behaviour of banks (and the financial system) and production firms some other time but let us briefly look at the government’s finances.
As we saw in the post Sources And Uses Of Funds, government’s expenditure is use of funds and the sources for funds is taxes, the central bank’s profits, and issue of bills (and bonds). Unlike households, however, the government is in a supreme position in the process of “money creation”. Except with notable exceptions such as in the Euro Area, the government has the power to make a draft at the central bank under extreme emergency, though ordinarily it is restricted. Wynne Godley and Francis Cripps described it as follows in their 1983 book Macroeconomics:
Our closed economy has a ‘central bank’ with two principle functions – to manage the government’s debt and to administer monetary policy. [Footnote: The central bank has to fund the government’s operations but this in itself presents no problems. Government cheques are universally accepted. When deposited with commercial banks the cheque become ‘reserve assets’ in the first instance; banks may immediately get rid of excess reserve assets by buying bonds.]. The only instrument of monetary policy available to the central bank in our simple system is the buying and selling of government bonds in the bond market. These operations are called open market operations. We assume that the central bank does not have the right to directly intervene directly in the affairs of commercial banks (e.g., to prescribe interest rates or quantitative lending limits) or to change the 10% minimum reserve requirement. But the central bank is in a very strong position in the bond market since it can sell or buy back bonds virtually without limit. This gives it the power, if it chooses, to fix bond prices and yields unilaterally at any level [Footnote: But speculation based on expectations of future yields may oblige the central bank to deal on a very large scale to achieve this objective.] and thereby (as we shall soon see) determine the general level of interest rates in the commercial banking system.
Given such powers, we can assume in many descriptions that the government’s expenditure and the tax rate is exogenous. However, many times, there are many constraints such as price and wage rises, high capacity utilization and low production capacity and also constraints brought about from the external sector due to which fiscal policy has to give in and become endogenous.
While I haven’t introduced open economy macroeconomics in this blog in a stock-flow coherent framework, we can make some general observations:
For a closed economy as a whole, income = expenditure. While it is true for the whole economy (worth stressing again: closed), it is not true for individual sectors. The household sector, for example, typically has its income higher than expenditure. In the last 15-20 years, even this has not been the case. If one sector has it’s income higher than expenditure, some sectors in the rest of the world will have its income lower than its expenditure. Many times, the government has its income lower than expenditure and we see misleading public debates on why the government should aim to achieve a balanced budget. When a sector has its income lesser than expenditure, it’s net lending is negative and hence is a net borrower from the rest of the world. It can finance this by borrowing or sale of assets. A region or a whole nation can have its expenditure higher than income and this is financed by borrowing from the rest of the world. A negative flow of net lending implies a net incurrence of liabilities – thus adding to the stock of net indebtedness which can run into an unsustainable territory. Stock-flow coherent Keynesian models have the power to go beyond short-run Keynesian analysis and study sustainable and unsustainable processes.
… it is important to have in mind that it is possible to get three kinds of trajectories with SFC models:
trajectories toward a sustainable steady state;
trajectories toward a steady state over certain limits;
explosive trajectories.
The analysis of SFC models’ dynamic trajectories and steady states is useful, first because it makes clear to the analyst whether the regime described in the model is sustainable or whether it leads to some kind of rupture—either because the trajectory is explosive or because it leads to politically unacceptable configurations. In these cases, as Keynes would say in the Tract, the analyst can conclude that something will have to change and even get clues about (i) what will probably change (since the sensitivity of the system dynamics to changes in different behavioural parameters is not the same); and (ii) when this change will occur (since the system may converge or diverge more or less rapidly).
Example
Note that Net Lending is different from “saving”. Say, a household earns $100 in a year (including interest payments and dividends), pays taxes of $20 and consumes $75 and takes a loan of to finance a house purchase near the end of the year whose price is $500. Assume that the Loan-To-Value (LTV) of the loan is 90% – which means he gets a loan of $450 and has to pay the remaining $50 from his pocket to buy the house. (i.e., he is financing the house mainly by borrowing and partly by sale of assets). How does the bank lending – simply by expanding it’s balance sheet (“loans make deposits”). Ignoring, interest and principal payments (which we assume to fall in the next accounting period),
His saving is +$100 – $20 – $75 = +$5.
His Investment is +$500.
His Net Incurrence of Liabilities is +$450.
His Net Accumulation of Financial Assets is +$5 – $50 = – $45.
His Net Lending is = -$45 – (+$450) = -$495 which is Saving net of Investment ($5 minus $500).
This means even though the person has “saved” $5, he has incurred an additional liability of $450 and due to sale of assets worth $45, he is a net borrower of $495 from other sectors (i.e., his net lending is -$495).
Assume he started with a net worth of $200.
Opening Stocks: 2010
$
Assets
200
Nonfinancial Assets Deposits Equities
0 30 170
Liabilities and Net Worth
200
Loans Net Worth
0 200
Now as per our description above, the person has a saving of $5 and he purchases a house worth $500 by taking a loan of $450 and selling assets worth $50. We saw that the person’s Net Accumulation of financial assets is minus $45. How does he allocate this? (Or unallocate $45)? We assume a withdrawal of $10 of deposits and equities worth $35. At the same time, during the period, assume he had a holding gain of $20 in his equities due to a rise in stock markets.
Hence his deposits reduce by $10 from $30 to $20. His holding of equities decreases by $15 (-$35 + $20 = -$15)
How does his end of period balance sheet look like? (We assume as mentioned before that the purchase of the house occurred near the end of the accounting period, so that principal and interest payments complications appear in the next quarter.)
Closing Stocks: 2010
$
Assets
675
Nonfinancial Assets Deposits Equities
500 20 155
Liabilities and Net Worth
675
Loans Net Worth
450 225
Just to check: Saving and capital gains added $5 and $20 to his net worth and hence his net worth increased to $225 from $200.
Of course, from the analysis which was mainly to establish the connections between stocks and flows seems insufficient to address what can go wrong if anything can go wrong. In the above example, the household’s net worth gained even though he was incurring a huge liability. What role does fiscal policy have? The above is not sufficient to answer this. Hence a more behavioural analysis for the whole economy is needed which is what stock-flow consistent modeling is about.
One immediate answer that may satisfy the reader now is that the households’ financial assets versus liabilities has somewhat deteriorated and hence increased his financial fragility. By running a deficit of $495 i.e., 495% of his income, the person and his lender has contributed to risk. Of course, this is just one time for the person – he may be highly creditworthy and his deficit spending is an injection of demand which is good for the whole economy. After all, economies run on credit. While this person is a huge deficit spender, there are other households who are in surplus and this can cancel out. In the last 15 years or so, however (before the financial crisis hit), households (as a sector) in many advanced economies ran deficits of the order of a few percentage of GDP. If the whole household sector continues to be a net borrower for many periods, then this process can turn unsustainable as the financial crisis in the US proved.
Now to the title of the post. Flows such as consumption, taxes, investment are income/expenditure flows. Flows such as “Δ Loans”, “Δ Deposits”, “Δ Equities” are financing flows. Income/expenditure flows affect financing flows which then affect balance sheets, as we see in the example.