Economists are increasingly recognizing the Euro Area problems as a balance-of-payments crisis, in addition to realizing that the Euro Area national governments cannot finance their deficits by making a draft at the Eurosystem in extreme emergency.
With a few exceptions, the benchmark cost of credit in each euro-zone country is related to the balance of its international debts. Germany, which is owed more than it owes, still has low bond yields; Greece, which is heavily in debt to foreigners, has a high cost of borrowing (see chart 2). Portugal, Greece and (to a lesser extent) Spain still have big current-account deficits, and so are still adding to their already high foreign liabilities. Refinancing these is becoming harder and putting strain on local banks and credit availability.
The higher the cost of funding becomes, the more money flows out to foreigners to service these debts. This is why the issue of national solvency goes beyond what governments owe. The euro zone is showing the symptoms of an internal balance-of-payments crisis, with self-fulfilling runs on countries, because at bottom that is the nature of its troubles. And such crises put extraordinary pressure on exchange-rate pegs, no matter how permanent policymakers claim them to be.
The magazine also had another nice article recently: Is this really the end?. Here is a collection of covers from the magazine in recent times on the Euro.
Alastair Marsh at FT Alphaville discusses the Euro Area problems looked through the prism of net international investment position (NIIP), quoting Goldman Sachs economist Lasse Holboell Nielsen:
When considering the causes of the ongoing Euro area debt crisis, it is natural to focus on public debt and deficits as the primary sources of market tensions. However, as the Irish experience demonstrates, private-sector debt can rapidly migrate onto public-sector balance sheets in the event of a financial crisis. It may therefore be more meaningful to look at the aggregate indebtedness of an economy, consolidating the public- and private- sector positions, in assessing a country’s vulnerability to sovereign yield tensions. [Italics not in original]
Nielsen is apparently trying to model government bond yields using NIIP data for some of the EA17 nations.
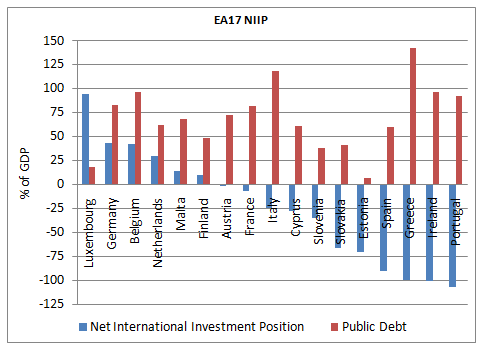
This blog had discussed this earlier in the post Eurozone Indebtedness. I re-did the graph and is below
A nation which is running a current account deficit and is highly indebted (proxied by the NIIP-GDP ratio) has to borrow from the international banking system, money markets and capital markets and refinance the debt and faces the risk of a run on its liabilities if the debt gets out of hand. The chart above gives an insight on why some EA17 nations face more troubles than others.
Marc Lavoie forwarded me the European Central Bank’s Monthly Bulletin, October 2011 which has a section on TARGET2 and the European monetary system. I have had good discussions with him on emails to nail the TARGET2 operations so it is good to see the conclusions being verified in publications. I am waiting to write a long blog post on TARGET2 and trying to collect sources I can quote/link and I came across a section on flow of funds in the same article. It appears on page 99 (page 100 of the pdf) and is titled The Financial Crisis In The Light Of Euro Area Accounts: A Flow-Of-Funds Perspective.
The article has this chart which will be very familiar to readers because it has been in the Levy Institute’s Strategic Prospects since many years.
There are some differences in terminologies. Wynne Godley (and Francis Cripps) started using NAFA (Net Accumulation/Acquisition of Financial Assets) to denote a sector’s surplus in the 1970s and Levy Institute has continued using this. Modern national accountants use Net Lending (by a sector) and split this into Net Acquisition of Financial Assets and Net Incurrence/Acquisition/Increase of/of/in Liabilities and take the difference. Levy’s authors also use Net Lending but as Net Lending to a Sector – e.g., Net Lending to Households.
The article also presents this table (termed Transactions Flow Matrix by Wynne Godley – his greatest trick)
(click to enlarge)
and has this description:
The sectoral accounts present the accounts of institutional sectors in a coherent and integrated way, linking – similar to the way in which profit and loss, cash flows and balance sheet statements are linked in business accounting – uses/expenditure, resources/revenue, financial flows and their accumulation into balance sheets from one period to the next.To this effect, all units in the economy are classified in one of the four institutional sectors (i.e. households, non-financial corporations, financial corporations and general government). Their accounts are presented using identical classifications and accounting rules (those of ESA 95), in a manner such that each transaction/asset reported by one unit will be symmetrically reported by the counterpart unit (at least in principle). Accordingly, the sectoral accounts present the data with three constraints: each sector must be in balance vertically (e.g. the excess of expenditure on revenue must be equal to financing); all sectors must add up horizontally (e.g. all wages paid by sectors must be earned by households); and transactions in assets/liabilities plus holding gains/losses and other changes in the volume of assets/liabilities must be consistent with changes in balance sheets (stock-flow consistency). The sectoral accounts are commonly presented in a matrix form, with sectors in columns and transactions/instruments in rows, with horizontal and vertical totals adding up (see the example in the table).
The first five rows of the table show the expenditure and revenues of each of the sectors (broken down into types of expenditure/revenue). In row 6, the difference between revenue and expenditure (the surplus/deficit) is shown.
The notions of revenue and expenditure are close to, but generally less encompassing than, the more traditional national account concepts of resources and uses. Income can then be defined as revenue (except capital transfers received) minus expenditure other than final consumption and capital expenditure (capital formation and capital transfers paid). For corporations, income corresponds to retained earnings. Savings is the excess of income over final consumption.
Surpluses/deficits are then associated with transactions in financial assets and liabilities in each sector. This is shown in rows 7 to 10. The bottom part of the table shows the stocks of assets and liabilities, which result from the accumulation of transactions and other flows. This table is extremely simplified (e.g. omitting an explicit presentation of the stock of non-financial assets).
The excess of revenue over expenditure is the net lending/net borrowing (i.e. financial surplus/ deficit), a key indicator of the sectoral accounts. Typically, a household’s revenue will exceed its expenditure. Households are thus providers of net lending to the rest of the economy. Non-financial corporations typically do not cover their expenditure by revenue, as they finance at least part of their non-financial investments by funds from other sectors in addition to internal funds. Non-financial corporations are thus typically net borrowers. Governments are also often net borrowers. If the net lending provided by households is not sufficient to cover the net borrowing of the other sectors, the economy as a whole has a net borrowing position vis-à-vis the rest of the world. Deviations from this typical constellation were apparent in several euro area countries before the crisis, in particular, with extremely elevated residential investment that resulted in households becoming net borrowers (as has been the case in the United States).
The adding-up constraints in the accounts require that any (ex ante) increase in the financial balance of one sector is matched by a reduction in the financial balances of other sectors. The accounting framework does not, however, indicate by which mechanism this reduction will be brought about, or which mechanisms are at play. The EAA makes it possible to track changes in net lending in the different sectors of the economy. It also specifies the financial instruments affected and shows how the transactions and valuation changes leave a lasting effect on the balance sheets of the sectors.
The article is worth a read.
The Bank of England also had a similar article recently but before: Growing Fragilities – Balance Sheets In The Great Moderation by Richard Barwell and Oliver Burrows and quotes the work of G&L (Godley and Lavoie). It also has a similar matrix as the ECB’s article.
(click to enlarge)
Godley and Lavoie build a series of closed accounting frameworks based on the system of National Accounts, which encompass: the standard national income flows, such as wages and consumption; the counterpart financing flows, such as bank loans and deposits; and stocks of physical and financial assets and liabilities. This framework lends itself to representation in a set of matrices. The first matrix captures flow variables (Table A.1). The columns represent the sectors of the economy and the rows represent the markets in which they interact. The matrix has two important properties. Each sector’s resources and uses columns provide their budget constraint — the sums must equal to ensure that all funds they receive are accounted for. And each row must also sum to zero, to ensure that each market clears — that is, the supply of a particular asset must be matched by purchases of that asset, to ensure that no funds go astray.
The table can usefully be split in two, with the top half covering the standard income and expenditure flows and the bottom half covering financing flows. The two halves of the table are linked together by each sector’s ‘net lending balance’, or ‘financial surplus’. The net lending balance can be used to summarise each sector’s income and expenditure flows as the difference between the amount the sector spends on consumption and physical investment and the amount that it receives in income. This difference must be met by financing flows — either borrowing or the sale of financial assets. In national accounts terminology, a sector’s net lending balance (NL) must equal its net acquisition of financial assets (NAFA) less its net acquisition of liabilities (NAFL). Across sectors, the net lending balances have to sum to zero, as all funds borrowed by one sector must ultimately come from another.
While it is useful to split the table for accounting purposes into income and expenditure flows and financing flows, it is important to note that the acquisition of financial assets and liabilities is not necessarily determined purely by imbalances between income and desired expenditure. Sectoral balance sheets can adjust for other reasons. Agents may want to borrow money to purchase assets, simultaneously acquiring financial assets and liabilities. And on occasion agents may want to shrink the size of their balance sheets, selling off financial assets to pay off financial liabilities. Finally, some agents may default on their debt obligations, which will involve a revision in the financial assets and liabilities of both debtor and creditor. At an aggregate level, simultaneous expansion of a sector’s assets and liabilities invariably represents one set of underlying agents taking on assets whilst the other takes on liabilities. The household sector provides an important example. If a young household takes a mortgage to buy a house from an old household, the sector in aggregate simultaneously acquires a liability (the young household’s mortgage) and an asset (the deposit created for the young household to pay to the old household).
All of these activities — leveraging up, deleveraging and default — involve NAFA and NAFL moving in lockstep. The net lending identity still holds: the gap between income and expenditure determines the difference between NAFA and NAFL. But the absolute size of the NAFA and NAFL flows is determined by agents’ actions in financial markets. The second table captures the balance sheet positions of each sector. The balance sheet matrix is updated over time using data on the acquisition of assets and liabilities from the transaction flows matrix, and revaluation effects to asset positions. Proceeding in this manner, balance sheets always balance across sectors, flows of funds are always accounted for over time and the impact of flows of funds on balance sheets is always recorded.
Again, good article!
The first time a proper transactions flow matrix appeared was in a 1996 Levy institute paper by Wynne Godley: Money, Finance And National Income Determination – An Integrated Approach.
Banca d’Italia – Italy’s National Central Bank – released its Financial Stability Report, Nov 2011 recently. With movements in Italian government bond yields making headlines, the following graphs from the report might be useful.
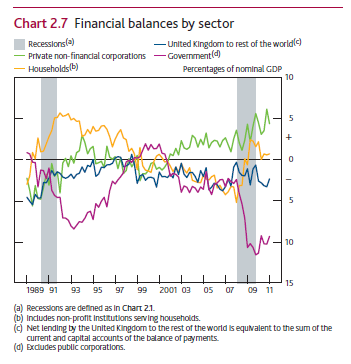
Wynne Godley used to say that fiscal transfers happen without anyone really noticing. From The Economist, fiscal transfers in the US (finally gets noticed!):
The Euro Zone is under a crisis. Is there a chart which shows what the underlying factor is which makes the difference ? Below:
You can see that the external situation is clearly the one which makes the difference as opposed to the public debt. It’s true that Belgium’s bond market is under pressure – creditors may not like high public debt but I think the graph is still useful.
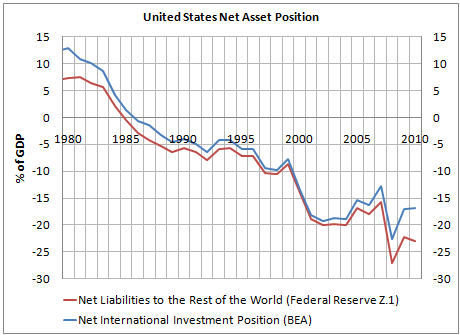
The Net International Investment Position is measure of how indebted a nation is. Why is that so ? Combine all the balance sheets of the sectors of a nation. Debts between residents cancel out and one is left with assets held abroad and liabilities to non-residents. One can replace “residents” with “citizens” and define a slightly different system of accounts and hence there is more than one way of doing it. The difference between assets and liabilities is called the net international investment position or net asset position. Below you see how this has changed over the years for the United States and how it has moved from positive to negative number territory over the years.
There are many discussions we can have one this – never ending ones! This could range from sustainability of this to whether this is problematic since most of the liabilities to foreigners is in US Dollars. Also, there are many stories on the movement of this graph with puzzles such as the dark matter problem. Each is worthy of being analyzed in detail, but for now my viewpoint:
The fact that liabilities to foreigners is in US Dollars is advantageous to the United States not because of the usual reasons given but because the liabilities do not suffer from revaluation losses if the dollar depreciates. But only advantageous at best. Not more.