I am having a discussion on the effects of the Federal Reserve’s Large Scale Asset Purchases (“QE”) especially on the money stock with someone online. Here are some thoughts.
First we have to be crystal clear that there is no direct causality from money to prices of goods and services.
Now, as I highlighted in my post Some Simple LSAP/QE Accounting, QE does increase the money stock if the ultimate sellers of the Treasury securities and mortgage-backed securities are non-banks.
Let me repeat the argument here:
Let us assume the Federal Reserve buys $10bn of Treasuries. We can have two scenarios – Scenario 1: purchase from banks and Scenario 2: purchase from non-banks. (In general a mix).
Scenario 1
Federal Reserve:
Change in Assets = +$10bn
Change in Liabilities = +$10bn
Change in Net Worth = $0
Banks:
Change in Assets = $0
(of which: change in reserves = +$10bn and change in Treasury securities = −$10bn).
Change in Liabilities = $0
Change in Net Worth = $0
Scenario 2
Federal Reserve:
Change in Assets = +$10bn
Change in Liabilities = +$10bn
Change in Net Worth = $0
Banks:
Change in Assets = +$10bn.
Change in Liabilities = +$10bn
Change in Net Worth = $0
Non-banks:
Change in Assets = $0
(of which change in deposits = +$10bn and change in Treasuries = −$10bn)
Change in Liabilities = $0
Change in Net Worth = $0
Summary:
In Scenario 1, the Federal Reserve’s assets and liabilities increase by $10bn since it has $10bn more of Treasury securities as assets and $10bn more of reserves as liabilities. The values of banks’ assets and liabilities do not change as it exchanges one asset for another and its reserves increase.
In Scenario 2, Fed’s balance sheet changes are the same as Scenario 1. Banks see a rise in reserves (assets) and a rise in deposits (liabilities). Nonbanks’ assets and liabilities do not change – just the composition of assets (they have $10bn of more deposits and $10bn less Treasury securities than before).
So in scenario 2, there is a change in deposits and the money stock rises as a result of QE.
On the other hand, it is observed by commentators that the money stock has not increased beyond the trend rise. This however seems contradictory to the previous analysis where it was shown that the money stock rose but these observations are not inconsistent because one has to compare the factual in which there is QE with the counterfactual in which there is no QE.
Although we could not have observed the counterfactual because it is another world, the following FRED2 graph gives some hints:
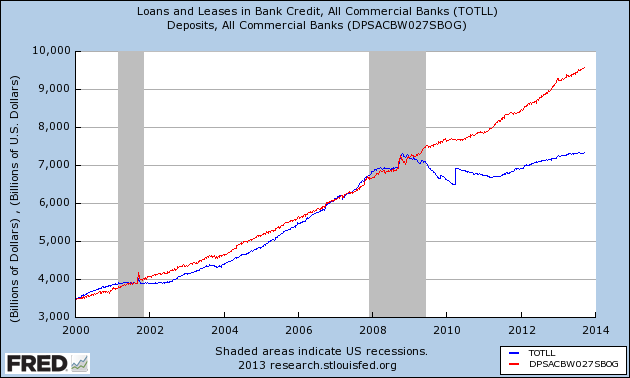
A more detailed analysis would look at all the balance sheet items of banks but at this point since the divergences between loans and deposits which moved hand in hand till the crisis is significant during and post-crisis, we may ignore the rest.
So in the above graph, it can be seen that deposits have not shown any rise above trend in the factual. However since the net creation of loans goes sideways, we may think that the money stock may not have risen by the trend and followed a path similar to loans in the counterfactual.
Because QE creates deposits, it – money stock moving sideways – didn’t actually happen and the money stock rose as per trend.
Of course there is also a lot of talk on the effect of QE on asset prices. I discuss this in my post Central Bank Asset Purchases And Its Connection To Tobin’s Theory Of Asset Allocation.
I also recommend Nick Edmonds’s blog Reflections on Monetary Economics for analysis on this.