Monthly Archives: March 2013

Cyprus Rescue

Cyprus has recently received the attention of academicians and financial professionals in recent weeks. Need I say that?

So national bankruptcy is to be resolved by winding down a bank, moving guaranteed deposits (i.e., upto €100,000) to another and as per the latest Reuters article on this, big numbers (anywhere ranging from 20 to 40 per cent loss on deposits on amounts over €100,000) are quoted.

Martin Wolf has a good summary:

The current plan is closer to what one would wish to see in an orderly bank resolution. Laiki Bank is to be split into good and bad banks. Deposits of less than €100,000 in the bank and assets worth €9bn – the sum owed to the central bank as part of its liquidity support – will be transferred to Bank of Cyprus. The remainder will be wound down. Those with claims to deposits in excess of €100,000 will obtain whatever the value of the bad bank’s assets turns out to be.

Meanwhile, savers at the Bank of Cyprus with deposits of more than €100,000 will have their accounts frozen and suffer a “haircut” of still unknown size. That reduction in value is likely to be large: perhaps 40 per cent. Finally, temporary exchange controls are to be imposed.

Why are the reasons for such huge numbers?

The reason is that the nation has accumulated huge net indebtedness to foreigners over years and this has been financed by banks raising deposits from foreigners, so that if debt traps are to be avoided, foreigners are to be required to take losses.

The following is the international investment position of Cyprus at the end of Q3 2012 (source: Central Bank of Cyprus)

Cyprus - International Investment Position Q3 2012
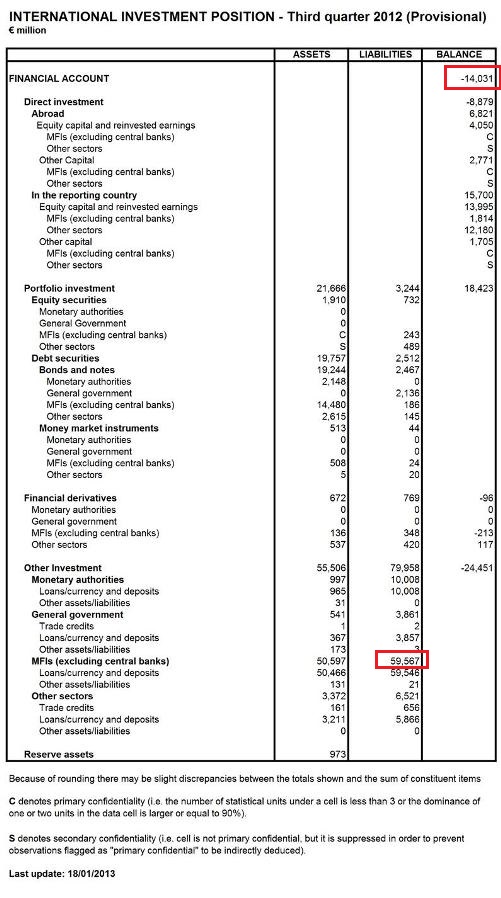
In the balance of payments literature, banks’ position is referred as Other Investment. Also, the above refers to a Financial Account but it really means net IIP. Ideally it would have been better if this data had been updated but the above information is useful nonetheless.

As a percent of gdp, the net IIP position (with the opposite convention to standard usage) was 81.1% (Source: Eurostat) which is big in itself but very much lower than the now famous banks’ liabilities to foreigners/Russians! (the second red box above).

If a nation wants to resolve bankruptcy, it is better to do it by imposing losses on foreigners – especially if an international lender of last resort is available! And if this is to done it in the optimal way, best to do it once – rather than keep doing it. The ratio of two red boxes in the table – i.e., net liability as a proportion of gross bank liabilities to foreigners is 24.56%.

So Cyprus needs to wipe out about this amount as a percent of deposits roughly. It is not necessary to reach a position of zero indebtedness but something low such as 10% of gdp is ideal. Some buffer is needed because there will be leakages in spite of capital controls – requiring fire sale of foreign assets (and subsequent losses) by banks or borrowing from the ECB which may want to ensure that banks have good collateral for the ELA. Foreign deposits below €100,000 shouldn’t be hit. So “net-net”, as a percentage, this may be higher than 24.56%. All this depends on the latest situation and the distribution of foreign deposits and also the distribution between residents and foreigners but 24.56% of deposits is a good starting point – it gives a rough estimate of the order of magnitude of the problem.

At any rate, losses imposed on foreigners have to be big for the ECB and Euro Area governments to stand behind.

The Saving = Investment Identity

Recently I have come across many people saying S = I is not correct or that it is valid only for a purely private economy.

People who come across the sectoral balances identity

S − I = G − T + CAB

sometimes mix up with another macroeconomic identity

S = I

They are unsure of the correctness of each or the kind of setup one or the other is valid. Or – how can both be valid?

The reason both are valid is that the former is a sectoral equation and the S refers to the private sector saving and in the latter, S refers to the sum of savings of all sectors of the world*.

Remember good authors always specify the terminology used and you should too always.

But the first equation doesn’t make the second equation invalid. It is just that the contexts are slightly different.

So in the first equation, S is the private sector saving, I is private sector investment and G is the government expenditure, T is tax receipts of the government and CAB is the current account balance of payments.

So, in case you want to use the two simultaneously, use different notations.

Take an example of a closed economy.

The government’s expenditure is comprised of current and capital expenditures.

So,

G = Gcurrent + Igovt

Government’s saving is T − Gcurrent

So

Spriv − Ipriv = G − T = Igovt − (T − Gcurrent)

and hence

Spriv − Ipriv = Igovt − Sgovt

So,

Spriv + Sgovt = Ipriv + Igovt

which is written as S= I in short by authors – which is fair because they assume a context.

There is source for further confusions. This is because of mixing of the same set of symbols for planned investment and planned saving with the recorded ones. Clearly, planned investment needn’t be equal to planned saving. However, it is always good when discussing ex-ante and ex-post variables to use different symbols.

Some authors mix notation everywhere in their analysis, and call others confused!

If one doesn’t keep track of notations, a more complicated analysis will produce nonsensical results.

If someone doesn’t understand this, his confusions are his problems, not others’.

*Savings used as a plural of saving and as a flow instead of informal terminology referring to a stock

The Heavenly Walrasian Auctioneer

When an economist talks of the “price mechanism”, it can be assumed that his theory is bunkum. Of course, it doesn’t mean that prices don’t play a role but the role played is entirely different than what the raw intuition of a normal person or the learned intuition for neoclassical economists says. Economists – neoclassical and their cousins – also talk of a Walrasian auctioneer whose role is to collect preliminary buy and sell orders, which he uses to find the “clearing” price. A look at the microstructure of markets reveals this is quite misleading and very incorrect inferences can be drawn from the price clearing story.

The blogger Lord Keynes (!) has a nice post quoting Nicholas Kaldor – mainly from his 1985 book Economics Without Equilibrium – The Okun Memorial Lectures At Yale University.

The following is from pages 13-18 – which have great insights on this. It draws heavily from Kaldor’s own paper from 1939: Speculation And Economic Stability.

Perhaps for that reason general equilibrium theory retains its fascination for teachers and students of economics alike. Indeed, judging by the number of Ph.D. students working on the implications of the rational expectation hypothesis, it is gaining ground, at any rate, in America. One reason is the intuitive belief that the price mechanism is the key to everything, the key instrument in guiding the operation of an undirected, unplanned, free market economy. The Walrasian model and its most up-to-date successor may both be highly artificial abstractions from the real world but the truth that the theory conveys — that prices provide the guide to all economic action — must be fundamentally true, and its main implication that free markets secure the best results must also be true. (This second proposition was indeed demonstrated but under assumptions so restrictive that Professor Hahn turned the argument around and suggested, in his inaugural lecture, that the importance of general equilibrium theory lies precisely in showing how stringent the conditions must be for “free markets” to secure the results in terms of welfare that are naively attributed to them. This may well be true, but if so, it is truth bought at a very high cost.)

But the basic assumptions in all this — that prices are very important in the working if a market economy — is rarely, if ever questioned. Yet it is precisely this over-emphasis on the role of the price system that I regard as the major shortcoming of modern neoclassical economics, particularly the Walrasian version of it.

The Role of Dealers and Speculators

Walras knows only two categories of “agents”: producers and consumers. He makes no mention of the third category which is vital to the functioning of any market economy, namely, the “dealer” or “middleman” (or “merchant”) who is neither buyer not seller, because he is both simultaneously. It is the dealers or merchants who make a “market” which enables producers to sell and consumers to buy, and who carry stocks of commodity the deal in in large enough amounts to tide over any discrepancies between outside sellers and outside buyers over any short period of time, and in practice fulfill the role designed for the “heavenly auctioneer” since they are the people who at any moment of time quote prices for purchases or for sales. They are not required under actual rules to buy or sell only at “equilibrium” prices — whatever that is taken to mean — though there are special markets, like the London bullion market, where the actual dealing price is struck after ascertaining the demands and the offers of dealers at various prices. (This is possible when, as in the London gold market, everybody’s demand and supply can be handled through a small number of dealers.) At any given moment of time, or to be a little more realistic, at the start of business, say the first thing in the morning, all prices are given to them as a heritage of the past. The important thing is that it is the dealers who initiate the price changes necessary for aligning, or rather realigning, the demand of the consumers and the supply of producers. They make their living on the “turn” between the buying price and the selling price; and the larger the market and the greater the competition between dealers, the less this “turn” is likely to be, as a proportion of price (always provided that the “turn” must be large enough to cover interest and carrying costs on stocks plus some compensation for the risk of a fall in market prices in the future). Thus buying or selling necessarily involves transaction costs that cannot be said to fall on the seller any more than on the buyer; they are divided between them, but it is not meaningful to ask how much falls on one side rather than the other.

Any discrepancy between sales and purchases (or “outsiders,” that is, of producers and consumers) is simultaneously reflected in the stocks (or “inventories” to use the American term) carried by merchants. Experience has taught them how large their “normal” stocks need to be in relation to their turnover in order to ensure continuity of dealing, for a dealer’s reputation (or good will) depends on his ability to satisfy his customers at all times; refusal or inability to deal is likely to divert business to others. They protect their stock by varying both their buying and selling prices simultaneously, raising prices when stocks are falling and lowering them when they are rising.

The size of price variation induced by a change in the volume of stocks held by the market depends on the dealer’s expectations of how long it will take before prices return to “normal” and how firmly such expectations are held. Even before the Second World War, the short-term fluctuations in commodity market prices (i.e., the markets of the staple agricultural and industrial raw materials, including metals) were very large. According to Keynes’s calculations in 1938 (in an article in the Economic Journal)* the average annual variation in the ten previous years between the lowest and the highest prices in the same year in the case of four commodities (rubber, cotton, wheat and lead) was 67 percent. Unfortunately, the corresponding figures for the fluctuations in stocks carried that were associated with these prices variations could not have taken place unless there were frequent changes in the prevailing expectations concerning future supplies of demands.

* “ The Policy of Government Storage of Food Stuffs and Raw Materials.” Economic Journal, September 1938, pp. 449-460

Nor is it known how far the price movements were exaggerated as a result of the activities of yet another class of “agents”, the speculators. Professional dealers act under the influence of price expectations, and to that extent their market behavior can also be regarded as speculative in character. But their actions are motivated by the desire to reduce the risks facing them (which they inevitably assume as dealers) by their willingness  to reduce their stocks in times of high prices and the opposite willingness to absorb extra stocks when prices are regarded as abnormally low. In any case the risks they carry are an inevitable by-product of their function as dealers. Speculators on the other hand assume risks for the sake of a gain and thereby provide facilities for hedging by buying “futures” from those who are committed to carry stocks of a commodity, and selling “futures” from those who are committed (by their productive activities) to acquire commodities in the future for uses for which they have already entered contractual commitments.

The activities of both dealers and speculators are supposed to smooth out both fluctuations in prices and variations in the size of inventories. Price rises should be moderated by the reduction of inventories held by dealers; similarly, a price fall should be moderated by a consequential increase in inventories. As Arthur Okun pointed out in one of his papers, * as a matter of “stylized fact” this is the very opposite of what actually happens.

The hallmark of U.S. postwar recessions has been inventory liquidation, following a major buildup of inventories at the peak of the expansion. Standard models that assume price-taking and continuous market clearing do not suggest that a disappointment about relative prices will lead to liquidate inventories. For example, a sudden drop in the demand for, and hence the price of wheat that leads farmers to decrease production in the future will generally lead traders to increase stocks initially. (The price tends to fall enough currently relative to its new future expected value to provide traders with that incentive.) Why then, in the business cycle, is an aggregate cut back in production accompanied by a cutback in stocks?

*Rational Expectations with Misperceptions As a Theory of the Business Cycle, proceedings of a seminar held in February 1980 and printed in the Journal of Money, Credit and Banking, November 1980, Part 2]

This was mentioned as the first of eight “stylized cyclical facts” that Okun regarded as inconsistent with the rational expectations hypothesis; it related to the behavior of a special class of “agents” whose main business it is to be rational in their expectations.

All this related mainly to the behavior of commodity markets which come nearer to the “auction markets” of general equilibrium theory than all the other “markets” in the economy. Yet they fail to satisfy the theoretical requirements from more than one point of view. First, they are not “market clearing” in the sense of equating demand and supply on the strict criterion that the maximum amount sellers desire to sell at the ruling price is equal to the maximum buyers desire to buy. There is a change in inventories from period to period, held by insiders in the market, that is quite un-Walrasian – it means that demand was either in excess of, or short of supply-the market has not “cleared” and the transactions, even in the shortest of periods, such as a day or even an hour, did not take place at a uniform price but at prices that varied sometimes minute by minute.

Nicholas Kaldor - Economics Without Equilibrium

Nicky Kaldor from the back cover of Economics Without Equilibrium

A Dubious FT Critique Of The UK ONS

On 28 Feb, FT’s columnist Chris Giles attacked the United Kingdom Office of National Statistics in his article titled UK’s official statistics cannot be trusted.

As his title suggests, Giles argues that the ONS is helping the UK government hide some public finances statistics and is losing its independence. His article is misleading to say the least.

Also see Jil Matheson’s reply to FT.

To see this one needs to understand some national accounts concepts. Usually economists and journalists err on simple concepts and Chris Giles does the same – leading him to his strange conclusions.

The government’s deficit is the difference between its expenditures and income (mainly taxes). The difference is financed by borrowing from the markets. This used to be called the PSBR – Public Sector Borrowing Requirement. The government also earns from the central bank’s profits. During any period of measurement however, the government also rolls over its maturing debt and the nomenclature changed to PSNB – public sector net borrowing.

So we had

G – (T + Fcb) = PSNB

where G is the government expenditure including interest payments (and including interest payments to the central bank), T is tax receipts and is the Fcb profits of the central bank (assumed to be remitted in full to the Treasury for simplicity). However, during the financial crisis, the UK government needed to bailout banks and to finance its purchases of newly issued equities, it needed to borrow more. Hence the above relation was no longer valid.

So

G – (T + Fcb) ≠ PSNB

However, the deficit is fundamentally the left hand side. The purchase of equities cannot be thought of as adding to the government’s deficit because the government acquires financial assets in return. Of course this adds to PSNB and hence also to the public debt. So to measure the real effects, the UK ONS proposed a measure PSNBex.

G – (T + Fcb) = PSNBex

This is as it should be – the bailout of banks by purchases of its newly issued equities cannot be said to be equivalent to an expenditure by the government which has a direct effect on aggregate demand. The bailout of banks although has its benefits – in the sense that they will be less constrained in lending – has an indirect effect and it will be captured when banks lend for a house purchases and this will reflect in investment expenditures. Of course the bank bailout has to appear somewhere in the accounts and it does and the UK ONS has been careful in doing it the right way.

In the Euro Area however, this is captured differently in national accounts and this is not the best way in the spirit of the accounts. So when the Irish government bailed out banks, it was measured as a huge rise in the deficit.

So here is from the Eurostat for the year 2010 and you can see Ireland visibly:

Eurostat_Graph_teina200

(Source: Eurostat. Click to enlarge)

Back to UK national accounts.

Assuming bailouts are in the past, i.e., not in the period of recording and also assuming no sale of equities by the government,

G – (T + Fcb) = PSNBex = PSNB

Now, the Bank of England has been has been purchasing government bonds in open markets as part of its Asset Purchase Facility program (strange word “facility”). It established a fund (or a financial vehicle) called Bank of England Asset Purchase Facility Fund Ltd which funded its purchases of UK government bonds by borrowing from the Bank of England. Over time, the BEAPFF has made profits on its operations and this is reflected in its cash balances at the Bank of England. The UK Treasury recently decided to transfer the cash to its own account (“raid” in the words of Chris Giles).

The cash transfer is an income flow from the Bank of England to the Treasury and hence reduces the PSNBex.

The ONS came with a technical note on how to measure this and Giles decided saw it as a proof that the ONS is not independent!

Although these effects seem intra-government, national accounts (SNA) treats the central bank as part of the financial sector and hence the transfer of the cash from BEAPFF reduces the PSNBex. Hence according to the ONS:

Following recommendations from the National Accounts Classification Committee (NACC), The Public Sector Finances Technical Advisory Group (PSFTAG) and Eurostat, it has been decided that:

  • The Asset Purchase Facility will continue to be treated as part of the Bank of England in National Accounts and Public Sector Finance statistics.
  • The flows of cash from the BEAPFF to HM Treasury, up to the level of the combined Bank of England’s ‘Entrepreneurial Income’ from the previous year, are treated as final dividends and therefore reduce the level of General Government Net Borrowing by that amount. However, anything above this level will be treated as a special transaction in equity, known as a super-dividend, which will not impact on the level of General Government Net Borrowing. (This calculation is known as the super-dividend test.) Whatever the impact on General Government Net Borrowing, the full value of the payments will impact on the General Government Net Cash Requirement.
  • Any flows of cash from HM Treasury to the Bank of England in the future to cover losses made by the BEAPFF will be treated as Capital Transfers and so will impact (in the opposite direction) on measures of General Government Net Borrowing and General Government Net Cash Requirement.
  • The BEAPFF as a whole should remain classified as a temporary effect of financial interventions as the end state of the BEAPFF remains unknown.
  • The payments between the Bank of England and Treasury should be treated as permanent effects and therefore impact on the headline measures of Public Sector Net Borrowing (PSNB ex) and Public Sector Net Debt (PSND ex), which exclude temporary effects of financial interventions.

All this is consistent with the principles of national accounts – how the central bank is treated and how various flows are measured and recorded etc. The government interest payment to the BEAPFF increases PSNBex and the cash transfer reduces it.

The ONS says clearly that in case the BEAPFF suffers a loss, there will be a capitalization by the government and this will be treated as a capital transfer and will impact government’s accounts – but in the future.

Yet in spite of very clear thinking and action by the ONS, Chris Giles erroneously concludes that “official statistics cannot be trusted”. His critique is vacuous.