Money is endogenous and is created as a byproduct of the production process. I came across this reference which supposedly shows that there is supposedly a one-to-one relationship between money and inflation and hence as a consequence – if we were to believe this – if the Bureau of Engraving and Printing were to work extra-time, this would lead to high inflation!
This is a highly misleading. Borrowing to produce something leads to an increase in demand and wealth and the private sector allocates its financial wealth into deposits and various securities. So money is a residual. Some of the increase in demand spills over to price rise and in exceptional cases can run out of control because of other reasons as well, leading to more borrowing and hence a growth in the money stock and higher inflation. But it is misleading to say that the growth of the money stock caused the inflation.
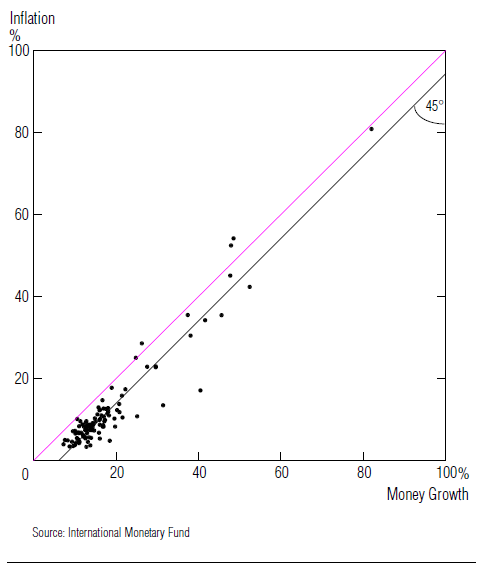
The reference is Some Monetary Facts from the Summer 1995 Quarterly review of the Federal Reserve Bank of Minneapolis which makes confusing statements about what the central bank does or should do. Here’s a graph from the paper supposedly establishing a connection between growth in the money stock and inflation. I added the pink line to make it look less scary 🙂
The points in the graph are average growth rates of the money stock and price rises for 110 countries.
According to the authors, the correlation is around 0.95 and the 45° line supposedly shows the tight link between money and inflation.
God we are in for a very high inflation soon!
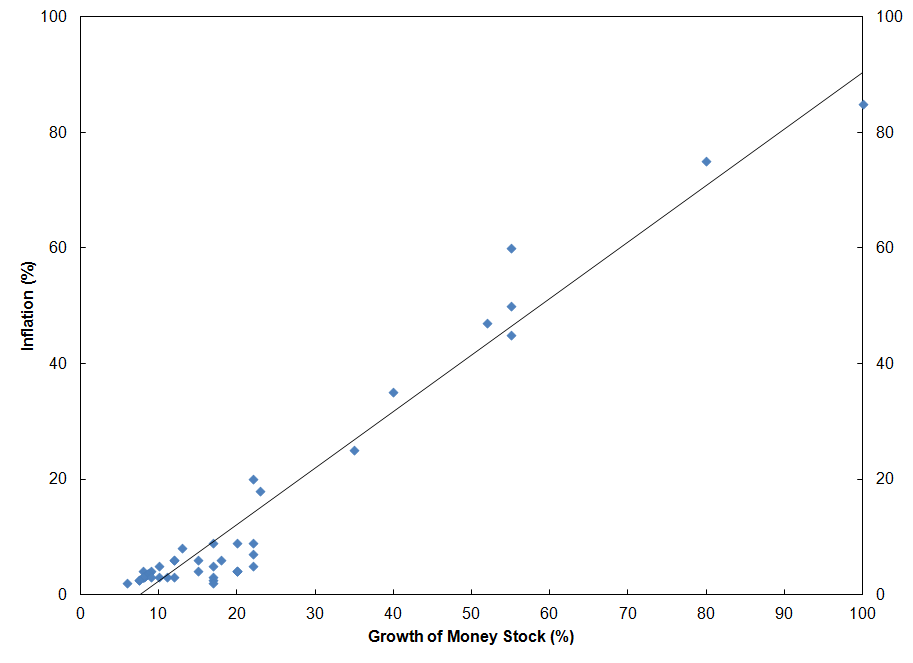
This correlation analysis can easily be produced by creating a data set with the same properties (high correlation, 45 degree line etc) and I was able to do so below:
The slope is nearly 1 (0.97) and a correlation of 0.97 (even better!).
When you look at the individual data, you will see that except countries with very high inflation, there is hardly any issue.
Here’s the excel sheet Money And Inflation.
If you were to remove the points with high inflation, the “monetary facts” as per the authors go away.
Of course, did money (or central bank open market operations) cause inflation in those countries – of course not. Money is a residual.
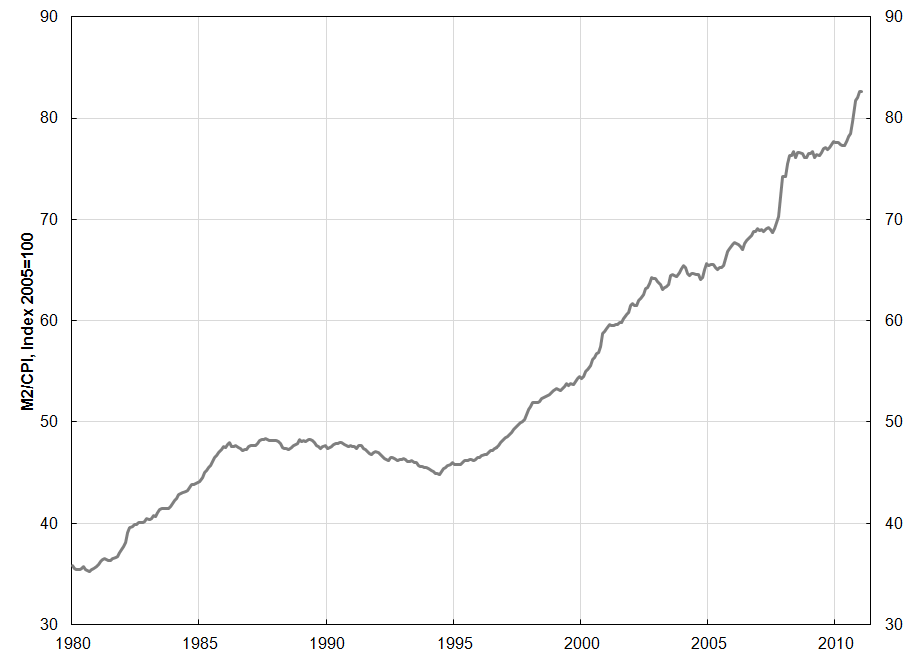
How does the M2/CPI look for the United States? Here’s the monthly graph of the ratio, with M2 in billions of dollars and CPI defined so that is equal to 100 in 2005. This following shows how wrong the “Monetarist intuition” is. Money didn’t increase one-to-one with prices and the ratio has grown from 35.8 to 82.7.
(Data Source: Federal Reserve Bank of St. Louis)
Note: The data in the excel sheet was created using random data and some amount of tweaks by me to reach the graph similar to the original Minneapolis Fed paper. So it is an imaginary data set created to have similar properties.


