The Flow of Funds Accounts provides one of the best snapshot of an economy. In an article appropriately titled ‘No one saw this coming’ – or did they? (see the full paper here), Dirk Bezemer correctly recognizes that the Economics profession’s ignorance of Flow of Funds had a big role to play in its inability to see a crisis coming. Bezemer says
We economists – and the policymakers who rely on us – ignore balance sheets and the flow of funds at our peril.
Of course, as Bezemer points out, there were exceptions. Post Keynesians were always aware of the flow of funds because monetary economy is a natural starting point in their theory. Wynne Godley and Marc Lavoie wrote a book (my favourite!) Monetary Economics: An Integrated Approach To Credit, Money, Income, Production and Wealth, Palgrave Macmillan, 2007, to unify Post Keynesian theory and the flow of funds approach, perhaps improving the presentation of the latter using something called the “transactions flow matrix”.
In my opinion, nobody even came close to Wynne Godley in not only predicting the crisis but the warning about the difficulties in resolving it.
One notable highlight of today’s Z.1 release was that
Household net worth—the difference between the value of assets and liabilities—was $57.4 trillion at the end of the third quarter, about $2.4 trillion less than at the end of the previous quarter.
A lot of readers will know about sectoral balances. How do we get that from Z.1? Table F.8 gives “Net Lending” of each sector of the economy. The difference in a sector’s income and expenditure is it’s “Net Lending”.
(click to expand, and click again to expand)
Before the crisis, the private sector had its income lower than expenditure and was financing the difference by borrowing from the other sectors. As the crisis hit, private sector expenditure retrenched – so you can see how the private sector has become a net lender from being a net borrower before the crisis. Because of this, the government’s borrowing increased from (line 49) $408.1bn in 2007 to $1,471.7bn in Q3 2011 (annualized). It was also due to a relaxation of fiscal policy during the crisis, in order to stimulate demand. The expenditure of the United States as a whole is higher than its income, and the difference is the current account deficit. This is financed by net borrowing from foreigners (line 42) – which was $446.7bn in Q3 2011 (annualized). This deficit was $715.9bn in 2007, bleeding demand at a massive scale from the US economy.
There are two more tables I see closely. The first is the net income payments from the rest of the world, which surprisingly remains positive, leading to a lot of literature about “dark matter”. (More on that some other time). This, according to the Z.1 is the “net receipts from foreigners of interest, corporate profits, and employee compensation”.
The Levy Institute has been tracking this since 1994. Here’s a latest graph (from their March 2011 analysis)
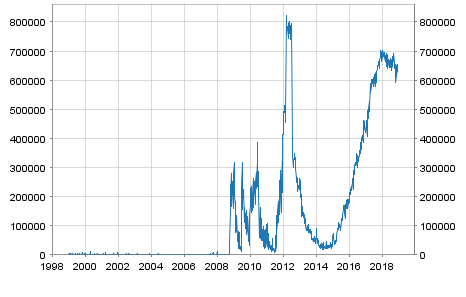
There are discrepancies between BEA and Fed data. The other table which I rush to check, whenever the flow of funds data is released is the United States’ net indebtedness to the rest of the world – L.107:
which at the end of Q3 was $3,616bn, or 24% of GDP.
There’s a new table – L.108, Financial Business – which actually appeared first time in the previous release (Q2). This sector had $64,299bn in assets and $60,457bn of liabilities at the end of Q3!
Of course, I look at all the tables at some time or the other. Highly recommended.
Mario Draghi is talking to press reporters now, as I write.
The ECB reduced reserve requirements to 1% from 2% and plans to do Long-term Refinancing Operations with maturity up to 3 years (i.e., it will lend banks for a term of three years). It also relaxed collateral standards.
The markets are in absolute roller coaster. Mario said that IMF borrowing from the Eurosystem and lending the governments is a violation of the spirit of the Treaty and repeatedly said monetary financing of governments is not allowed because the Treaty embodies the best tradition of Bundesbank and that fiscal retrenchment will enhance confidence of the markets! Central bankers can’t give up their dogmas, can they?
And to make his point clear, he again repeatedly said “no financing of governments” and while reporters tried no end to get something from him, he said “I wish all our leaders the best, and the ECB is here — which does not mean the ECB will respond” !
Here is FTSE MIB (FTSE’s Index for Italian Stocks)
(Source: Google Finance)
Here’s a chart of EURUSD from my iPhone CitiFX app
For countries in net external liability positions, including the eurozone’s peripheral economies, we see growing risks to the funding of their external requirements. In our view, financial institutions located in countries in net external asset positions (such as Germany) also face pressure where the quality of those assets is deteriorating.
So it seems to understand that the problem of the Euro Area is severe internal imbalances leading to high net external debt.
S&P also wrote an article titled Why Trade Imbalances For Creditors As Well As Debtors In The Eurozone Are Weighing On Growth, a few days back. Available through S&P’s Twitter update
click to view the tweet on Twitter
A wisecrack:
More fundamentally, large imbalances between the 17 member economies remain; after many years of high current account deficits in net debtor eurozone countries, these economies have built up substantial levels of net external debt. Such high levels of external leverage will weigh on economic growth prospects–in both net debtor and net creditor eurozone countries–over the next several years. How imbalances between them are unwound, and under what conditions, could determine the success or failure of policymakers in addressing the European debt crisis.
Australia
More on net indebtedness. Australia’s ABS released its Balance of Payments and International Investment Position, September 2011. It has this chart on Australia’s Net International Investment Position (with sign reversed in their convention):
So around 60% of GDP. Highly indebted nation!
Australia’s debt is both in domestic and foreign currencies and banks have hedged most of the foreign currency exposure hedged using foreign exchange derivatives. Australia’s government has almost zero liabilities in foreign currency.
Some people claim that as long as the debt to foreigners is in domestic currency, it doesn’t matter for some kind of “intuitive” reasons. My view is that while it is true that it is advantageous to incur liabilities to foreigners in domestic currency, my reasons are entirely different. A liability in domestic currency prevents revaluation losses if the exchange rate depreciates. A net indebtedness to foreigners is still a burden. A point rarely understood.
Martin Wolf wrote a blog post yesterday on FT: Understanding sectoral balances for the UK where he compares the sectoral balances for the United Kingdom and the United States.
To me both the similarities and differences are interesting. The following charts are from his post:
Does it matter? Yes and No. Will have to wait for the markets to open tomorrow, although SPX and EURUSD moved a bit after FT put out the news.
The Euro Area monetary union has designed itself to be dependent on rating agencies. For example, the “Eurosystem Credit Assessment Framework” outlines what kind of collateral are acceptable for borrowing (by banks) from their home National Central Bank. So eligibility and “haircuts” depend on ratings. If a national government’s rating gets downgraded, most private sector securities issued by the nation can be impacted. It is true that for a while, some issuers had their ratings higher than their sovereigns (possible!), time has arrived when they will be impacted too. With a general shortage of collateral, this will make the situation worse.
And of course, if markets start pricing a higher credit risk based on S&P’s opinion, there needn’t be an explanation of how things can go wrong.
Wolfgang Münchau’s strong views are always worth reading. Here’s from today
Click the above to go to the FT page if you have a subscription. Else you can read it via Business Spectator
Münchau says
With five days to go, the world is waiting for a big political signal. What I fear is a fudge, consisting of a multi-annual fiscal retrenchment, no eurobond, at most a temporary debt redemption instrument. The ECB will provide liquidity measures to stabilise the financial sector, and it will also provide a backstop for the bond markets. But I find it hard to see how Mr Draghi can agree an unlimited guarantee in the absence of a political union and a eurobond. A strengthened stability pact is not a fiscal union.
The way the negotiations are going now, I can see a compromise, but no solution.
This is a continuation of posts The Eurosystem: Part 1, Part 2, and Part 3 in which I went through a description of the payment system TARGET2 both domestic and cross-border and the process of how banks obtain reserves from the Eurosystem.
This post will go into the details of the Eurosystem operations. Like all central banks, the ECB simply targets interest rates, in particular the EONIA – the Euro Overnight Index Average . It is “[a] measure of the effective interest rate prevailing in the euro interbank overnight market. It is calculated as a weighted average of the interest rates on unsecured overnight lending transactions denominated in euro, as reported by a panel of contributing banks” according to the ECB website.
It should be noted outright that at some places in the ECB website, there are claims that it controls the money stock. A closer investigation shows no sign of the ECB doing anything of the sort and this claim is just a rhetoric. The Eurosystem is acting just like other central banks, changing short term interest rates and attempting to impact demand. It is impossible for any central bank to control the money stock. I had two posts on money endogeneity: Horizontalism and More On Horizontalism.
Reserve Requirements
Credit Institutions (banks) have an account at their home NCBs and have to maintain a minimum of 2% of their liabilities subject to reserve requirements. The ECB can change this from 2%, but it has never done this so far. Different central banks have different rules on which liabilities are to be included when calculating reserve requirements. For the Eurosystem, overnight deposits, deposits with maturity up to two years are included and so are debt securities with maturity up to two years. Repos, liabilities vis-à-vis other credit institutions including the Eurosystem, debt securities with maturity greater than two years are not included.
Deposits subject to reserve requirements are remunerated at the rate of the main refinancing operations (MROs).
Needless to say, reserve requirements do not reduce banks’ ability to make loans – since loans make deposits and deposits make reserves.
How do banks, as a whole, get the extra (not excess) reserves after they make loans? Either via Standing Facilities, which we consider next or through Open Market Operations.
Standing Facilities
The Eurosystem uses a corridor system for targeting interest rates. Banks can use the deposit facility and are paid interest on excess reserves and can borrow against eligible collateral under the marginal lending facility. For latter, how much? As much as they can, provided they have collateral. According to an old document from the ECB, saying the same:
So the interest rates on the deposit and marginal lending facilities act as a corridor.
In “good times”, banks will lend all their excess reserves to other credit institutions. Since the Eurosystem is adjusting the amount to reserves to hit its interest rate target, some banks may fall short of reserves which they can easily borrow from other banks. Because of uncertainty, some banks will be driven to the marginal lending facility and the Eurosystem will try to fine tune to reduce this. In may also be the case that the banking system as a whole is left with excess reserves and the Eurosystem may try to fine tune this in reverse direction (and will in “good times”). We will see how this happens in the next section.
For what happens during the day, see the end of Part 1 of this series.
But … the crisis hit, and banks became suspicious of other banks’ creditworthiness and this led to a freeze in the interbank market. Banks were cautious in lending each other and also about their own liquidity needs. Thus, they kept a lot of deposits at their home NCB. So one hears of banks “parking” a lot of funds at the Eurosystem. The following chart from the ECB Statistical Data Warehouse highlights the stress in the interbank markets. The y-axis is in Millions of Euros.
Chart updated 6 Dec 2018, as the previous link was broken.
Before we go into Open Market Operations, a table summarizing the Eurosystem’s operations (from the same document linked above)
Government Deposits
For reasons not clear to me, monetary policy documents do not emphasize an important fine tuning operation – shifting of government deposits between NCBs’ and banking system’s books. Movement of funds into and from the government’s account at its home NCB can cause a lot of errors in forecasting liquidity and can cause fluctuations in the rate at which banks are lending each other overnight. At the same time, if managed sufficiently well, it becomes a good tool for fine-tuning! This link from the ECB’s website has some discussion on this.
Open Market Operations
Via, open market operations, the Eurosystem manages banks’ needs for reserves. It neither controls the money stock in the Euro Area nor controls the amount of reserves in any sense of the usage of the word “control”. It may pursue a non-accommodating or a dynamic policy, where it hikes the interest rate, depending on the growth of the money stock but gone are the days of Monetarism! The Eurosystem is defending its target rate, the main refinance rate, which is usually mid-way between the rates for the deposit facility and the marginal lending facility. In recent times, due to banks’ high credit risk, it has lost control of this.
As per Table 1 above, the Eurosystem categorizes its operations as
main refinancing operations,
longer-term refinancing operations,
fine-tuning operations and
structural operations.
We can also describe them – as done by the “Monetary Policy Implementation” document – as follows:
Reverse transactions: MROs, LTROs, Fine-tuning Reverse Operations and Structural Operations;
Outright Transactions;
Foreign Exchange Swaps;
Issuance of ECB Debt Certificates, Collection of Term-deposits.
Before we get into a description of the above items, it should be made clear from the start, that the reader should keep in mind the similarities and differences between this and the procedures adopted by the Federal Reserves in the United States. As mentioned in Part 1, the Federal Reserve and the banking system can be described as asset-based type, while the monetary system in the Euro Area as an overdraft monetary system. (It should also be made clear that “overdraft” here does not mean national governments have an overdraft facility at their home NCB – they don’t have).
For example, it is easy to confuse MROs and LTROs with the (non-permanent) open market operations done by the Fed. The confusion arises because both MRO/LTROs and the Fed’s open market operations are carried out using repurchase agreements (repos). I will have another blog post on the Federal Reserve procedures, but suffice to say here that the Fed’s repos are more comparable to Fine-tuning Reverse Operations.
Reverse Transactions
As mentioned, earlier banks as a whole in the Euro Area obtain all reserves by directly borrowing from the Eurosystem. An exception is that in recent times, banks have seen their reserves increase due to the ECB’s two programs – Securities Markets Programme and Covered Bond Purchase Programme.
Let us consider MROs first.
Every week, the Eurosystem refinances the liquidity needs of the banking system via this operation. According to the implementation document,
- They are liquidity-providing operations. – They are executed regularly each week. – They normally have a maturity of one week. - They are executed in a decentralised manner by the National Central Banks. - They are executed through standard tenders. – All counterparties fulfilling the general eligibility criteria may submit tender bids for the main refinancing operations. - Both tier one and tier two assets are eligible as underlying assets for the main refinancing operations.
So every week, the Eurosystem lends banks amounting billions of Euros via an auction but these are executed in a decentralised manner by the NCBs as repurchase agreements. (Edit: 21 Dec 2011: A bit incorrect to term MRO/LTROs as “repos”). During the week, funds flow in all directions and banks will borrow from each other.
What about LTROs?
These are almost similar to the MROs, except that they are executed every month and normally have a maturity of three months. In recent times, the ECB has been more accommodative and has offered LTROs with longer maturities such as six months.
Since the frequency of MROs is one week, there needs to be some tool for the Eurosystem during the week to fine tune reserves so that interbank lending rates do not deviate from the target. So Fine-tuning Reverse Operations. These need not have fixed maturities and can be done in short notice but executed in a decentralised manner by the NCBs. About Structural Reverse Operations, I have nothing to say!
Outright Transactions, FX Swaps, ECB Debt Certificates & Term Deposits
In addition, the Eurosystem may employ other tools to provide or remove liquidity such as outright purchases or sales of domestic securities or entering into foreign exchange swaps with financial institutions. These are generally decentralised i.e, executed by the NCBs but the ECB may sometimes be involved. Collection of term deposits and issuance of ECB debt certificates absorb liquidity (i.e., reserves). The former is executed by the NCBs. Debt certificates are settled in a decentralised manner by the NCBs. Another difference between the two is that the former is not marketable, while the latter is.
Conclusion
A bit boring, wasn’t it? Haven’t yet covered ELA (Emergency Loan Assistance), SMP (Securities Markets Programme) and CBPP (Covered Bond Purchase Programme). My aim was to detail out the monetary operations so that we know what the Eurosystem does, what it doesn’t and what it can do (and what it cannot do!). Probably ELA, SMP & CBPP for the last part in the series – Part 5.
Addendum
How does the ECB change short term interest rates in normal times? By a simple announcement. Banks will automatically start lending each other at the target rate. MROs are done weekly, and there will be no additional MRO that needs to be done post/pre the announcement. Neither do fine-tuning reverse operations change in volume because of the decision.
John Cassidy of The New Yorkercomments on the failed austerity policies in the UK:
During the past eighteen months, a callow and arrogant Chancellor of the Exchequer, empowered by a hands-off Prime Minister and backed by the bulk of the country’s financial and media establishment, has needlessly brought Britain to the brink of another recession by embracing draconian spending cuts that hark back to the early nineteen-thirties. Rather than changing course and taking measures to boost growth, the Conservative-Liberal coalition is doubling down on austerity. On Tuesday, it announced plans to extend its cuts for two more years, until 2016-2017. “Until now, we had been thinking of four years of cuts as unprecedented in modern times,” Paul Johnson, the director of the non-partisan Institute for Fiscal Studies, said. “Six years looks even more extraordinary.”
The following was written in The Guardian in early 1981. Click to enlarge. And click again to enlarge.
According to FT,
In the early 1980s, when recovery from global recession was slow, the jobless rate more than doubled, soaring from 5.3 per cent in August 1979 to 11.9 per cent in 1984.
Seems nothing has changed in the last 30 years! Although, the Bank of England has dropped the bank rate to 0.5%, the present budget policies of the UK Government is a hangover of Thatcherism.
The Bank of England released the semiannual Financial Stability Report, December 2011 today. Complete book here. These reports have a lot of information, in addition to being well-written, well-formatted and colourful.
The following graph shows how international banks’ funding from US Money Market Mutual Funds changed during the year.
It also plots the Net International Investment Position (the negative of a nation’s debt) – which I have plotted many times in this blog (see here and here for example) and linked to other sources who have plotted it recently and is the reason for my writing this post!
It also has a chart on global imbalances with a focus on EA imbalances
Nice report. Go read.
Update: FT Alphaville’s post BoE charts, UK banks’ gloom also discusses some (different) charts from the report.
 (click to expand, and click again to expand)

 which at the end of Q3 was $3,616bn, or 24% of GDP.


