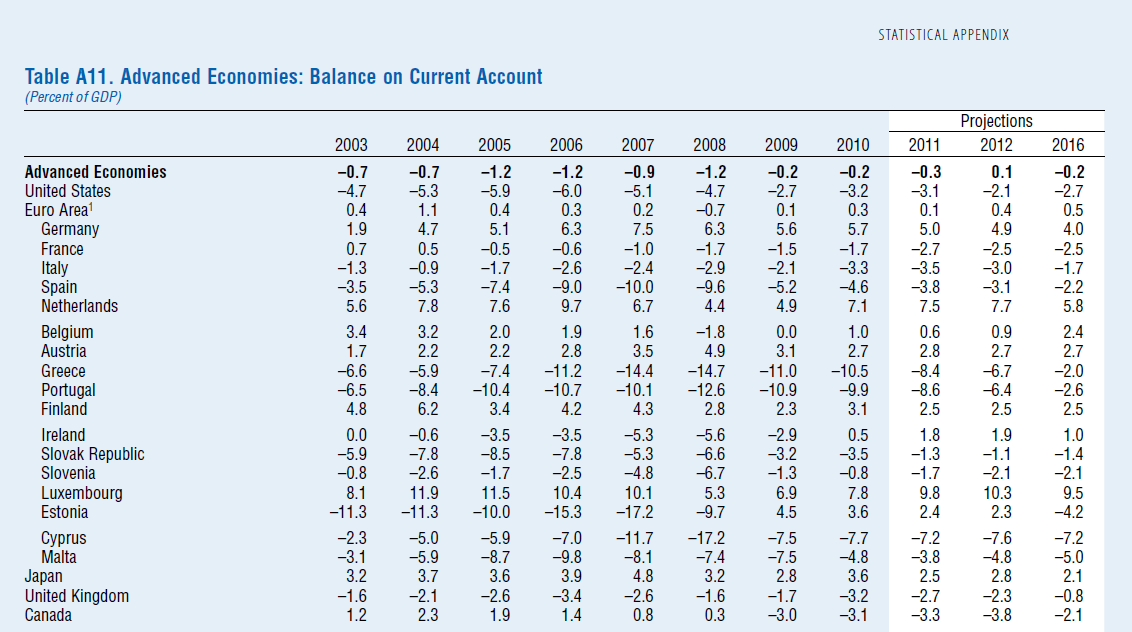
In a recent post Chart: Euro Zone Indebtedness, I graphed the Net International Investment Position (the negative of “external debt”) for EA17 nations to highlight the severity of internal imbalances within the Euro Area. I found a source of data for the current account balance as a percentage of GDP in the IMF’s latest World Economic Outlook and am posting a screenshot below of the table I am talking about.
(It’s a bit of hard work to get this otherwise). Click the image to enlarge. You can see that around 2007, the imbalances grew out of control but continued to grow in 2008.
