Tag Archives: 2008 SNA

Respect For Identities

The accounting identities equating aggregate expenditures to production and of both to incomes at market prices are inescapable, no matter which variety of Keynesian or classical economics you espouse. I tell students that respect for identities is the first piece of wisdom that distinguishes economists from others who expiate on economics. The second? … Identities say nothing about causation.

– James Tobin, 1997, p. 300, ‘Comment’, in B.D. Bernheim and J.B. Shoven (eds), National Saving and Economic Performance, Chicago: University of Chicago Press.

This is such a nice quote by James Tobin. Almost all economists, orthodox or heterodox would agree with it I believe.

In practice, however, economists confuse identities for behaviour and causation no end. They even confuse identities themselves. But it now seems that some think that usage of national accounting identities produces erroneous conclusions.

In a series of posts, (here and few posts before), David Glasner, the author of the blog Uneasy Money — Commentary on monetary policy in the spirit of R. G. Hawtrey, seems to be suggesting that letting identities go is the way forward for macroeconomic modeling.

Glasner says:

There are two reasons why defining savings and investment to be identically equal in all states of the world is not useful in a macroeconomic theory of income. First, if we define savings and investment (or income and expenditure) to be identically equal, we can’t solve, either algebraically or graphically, the system of equations describing the model for a unique equilibrium.

[boldening and emphasis added]

So it seems that using accounting identities in your model would lead to inconsistencies. I and a few other commenters have tried to convince Glasner of his errors in series of posts.

Some people seem to think that identities do not tell anything. The truth is not so straightforward. Identities constrain outcomes. Any macroeconomic model which does not use identities as constraints may produce non-possible states of the world.

Brad deLong confronted Glasner on Twitter with this point:

click to view on Twitter

If you have time, interest and energy, please convince Glasner that accounting identities cause no issues in macroeconomic modeling.

Credit And Economic Growth

In a new column for Bloomberg, Noah Smith questions the intuition that credit fuels economic growth.

click to view on Twitter

He says:

It seems like the only people who don’t instinctively believe in credit-fueled growth are academic economists.

The academics have good reason for being skeptical.

His reason (in short) is the following:

It’s pretty obvious how credit drives my personal household consumption. If I borrow, I can get a nice big TV and a new car, but eventually I’ll have to skimp to pay it back. In a way, the consumption-fueled borrowing binge is an illusion of wealth — after all, borrowing doesn’t increase my salary. Pleasure today means pain tomorrow.

Notice how Smith’s argument uses a lot of national accounting and flow of funds concepts: consumption, borrowing, wealth, repayment (of loans) and so on. The interesting thing is that one can use the system of national accounts and flow of funds to create models which show precisely the opposite of what Smith is saying. The best place obviously to look out for is the book Monetary Economics: An Integrated Approach to Credit, Money, Income, Production and Wealth by Wynne Godley and Marc Lavoie which has models called stock-flow consistent models or SFC models. It is however difficult to write down a simple SFC model in a blog post, so I will try to highlight how it works in words but refer the reader to these models.

Here’s how in a simple model:

  1. Consumers decide to borrow more and banks respond by granting them loans.
  2. Consumers spend the funds received on consumption goods.
  3. Since loans make deposits, it’s not as if someone forgoes consumption to lend as neoclassical textbooks say.
  4. Firms see their inventories go down and respond by increasing their inventories by producing more.
  5. For producing more, firms hire more labour and pay salary/compensation.
  6. People newly employed spend their income and there’s further rise in production as firms produce more when seeing a higher demand for their products.
  7. Higher production leads to a rise in productivity and wages/household incomes of the already employed rise in response (although not necessarily the case).

So we have a higher output than what we started with and higher national income.

One can take several issues with this and this is one reasons models are really helpful and pinpoint what’s going on. This is the reason I referred to the book by Godley and Lavoie above. So for example, one can ask: what if the rise in the national income and output is just a rise in the nominal value but that it’s possible that prices have changed and that the real output hasn’t changed. This of course needs a model of prices and inflation but a familiarity with stock-flow consistent models will make you realize that it is an extreme assumption to think that the real output hasn’t risen in the sequence of events highlighted above.

The second thing is the above “model” in words had just banks lending to households whereas in the real world, credit (as in any credit, such as firms borrowing) is via credit markets of which banks are only one part. This issue is not so simple to argue out, but it can be shown that it really doesn’t matter (in the first approximation). I do not know how to quickly argue it out in short here but will leave that for now.

Of course the above model can be misleading. For example, if households take a lot of debt, debt repayment burden will hit and cause a slowdown as households’ consumption will drop and this may lead to an economic slowdown. This point may look similar to what Noah Smith is saying, but that is not the case. One can imagine an economy starting with a GDP of 100 and growing to 120 in some time period and then slowing down to 118 because of the debt burden. Also the above model was implicitly a pure private sector model and in general one has both the government and the overseas sector adding more complications. Again more reasons why having a proper mathematical model for such things is important.

Another critique of Smith (in my mini-exchange of tweets with him on Twitter) was that SFC models do have behavioural assumptions. I agree, but my point was that there’s no reason to dismiss the argument “credit fuels growth” by purely theoretical arguments. If at all, the system of national income and flow of funds make it more convincing that credit is important.

Of course none of this means that policies should be promoted to ease credit conditions always and try to create a boom and what Smith says is somewhat true – there can be pain later, so it is important to consider fiscal policy, balance of payments and so on but the story told here is quite different from the one told by Noah Smith.

Paradox Of Profits?, Part 2

In the previous post Paradox of Profits?, I mentioned how I view the paradox of profits as the confusion between production firms’ operating surplus (as defined in the SNA such as the 2008 SNA or earlier versions) and surplus on the financial account of the system of national accounts.

The paradox is highlighted by saying that at the beginning of the monetary ‘circuit’, firms inject an amount of money M and can only recover a maximum of M.

So let us think of an economy in which there is no money or banks initially and suddenly someone producers find a way to make cakes and the banking system opens simultaneously. This is admittedly an oversimplification but nonetheless useful.

Initially firms decide to make 100 cakes and price it $1 per cake. They hire labour and pay $60 as wages. For this, they borrow $60 from banks. Households is a mix of both labour and entrepreneurs.

Now households consume cakes worth $55.

Before proceeding, it is important to note that inventories will be valued at current costs. So even though firms have initially paid households $60 and recovered $55, they have still made a profit of $22. This is because 55 cakes were sold and cost $55 × 0.6 = $33.

So:

Profits = $22

I am neglecting the interest costs on loans but this is minor in comparison to the income generated by production so as to matter crucially.

That profits are $22 can be seen from the profits formula of the previous post:

Ff  = C ΔIN  WB  rlL

Having sold 55 units of cakes, firms have 45 units left in their inventory. But since inventories are valued at current costs, the multiplicative factor here is 0.6, so ΔIN  = $27. So,

$22 ≈ $55 + $27 − $60 − ε

After having paid their employees, firms started out with no bank balance but soon have $55 in bank deposits. They then pay back $33 of loans, leaving them with $22 of bank deposits. At this stage household hold $5 of deposits: they received $60 and consumed $55.

So total bank deposits is $27. This is equal to the value of inventories. This is also equal to the initial loan of $60 minus the repayment of $33. So firms’ inventories are backing the loan amount.

Firms are now in a situation to distribute dividends. It is clear that they don’t have trouble paying interest to banks. (In this example but not always the case).

Another production cycle starts. Dividends will buy more cakes and make more profits for firms. Fixed capital formation can also be added in the story without any problem.

Paradox Of Profits?

Post-Keynesians unnecessarily worry a lot about the paradox of profits. This post is on my thoughts on the paradox. In my view, there is no paradox at all. It is simply the case of not looking at all the parts of the system of national accounts/flow of funds.

Although Post-Keynesians use Kalecki’s profit equation in which the government deficit adds to profits, the statement of the paradox is for a pure credit economy. But in any case, there is none.

Let us assume that at the beginning of the ‘circuit’, production firms need an initial loan to pay the wage bill WB in advance. Households receive the wages and consume and allocate their saving in financial assets (households don’t buy houses). The two financial assets are money and equities so:

WB − C = ΔM + ΔE

Production firms’ profits Fis:

Ff  I – WB rlL

Here, is the gross fixed capital formation of production firms or investment, L is the outstanding loan of firms from the banking system and ris the rate of interest on these loans.

Now assume all investment is financed by issuing equities (i.e., ΔE = I). With a small amount of algebra:

Ff  = − ΔM  − rlL

So this is the “paradox”.

Now there are several things wrong with this. The simplest is that profits are actually paid to households and there’s a term for change in inventories missing in the right hand side. If profits are not paid, they are retained and investment is then financed by both issuing equities and retained earnings. So ΔE ≠ I. 

There is an alternative way of stating the “paradox” which says: if firms inject money at the start of the production process, how do they recover more money at the end of the process? This seems to confuse what is known as operating surplus in the system of national accounts (such as in the 2008 SNA or earlier versions) with the surplus on the financial account.

So let us redo this. Here is the transactions flow matrix for the economy (assuming away banks’ undistributed profits):

Paradox Of Profits - Transactions Flow Matrix

First assume all profits are distributed (i.e., FUf = 0 and FDf Ff).

So:

 WB + rmF + F− C = ΔM + ΔE

Ff  = C I + ΔIN  WB  rlL

Then assuming ΔE = and a bit of algebra,

ΔIN = ΔM

In other words, there is no paradox at allFf  has simply dropped outAll this means is that if households wish to hold more of their assets in deposits instead of equities, firms will be left with more inventories.

Of course, you might ask, “how have you assumed that profits are distributed when there is a paradox?”. The answer is that I haven’t done anything self-inconsistent. More consistency checks would be via constructing a dynamic model and check if it solves but assuming it does, the above static analysis is good enough. There is no paradox to begin with.

So in the above, although there was no paradox of profits, there was still a pressure on output and hence profits—if households wished to hold more of their wealth in deposits and reduce their preference to buy equities, firms will be left with more inventories and will have to reduce investment. This reduction in investment happens because of two reasons – a fall in equity prices and a fall in output leading to a fall in firms’ expectations of sales. Of course, this can be seen via writing dynamic models, and one shouldn’t rely on identities. But bank loans will be useful here and so higher preference for ‘money’ needn’t necessarily lead to a fall in output. If households wish to hold more money instead of other assets, firms may switch to bank loans and this process creates deposits.

But let’s for the moment still assume that investment is not financed via bank loans but via issuance of equities and retained earning. In this case,

WB + rmFD + Fb − C = ΔM + ΔE

Ff  = C I ΔIN  WB  rlL

but also,

ΔE = I  FU

and with some algebra,

ΔIN = ΔM

Again, no paradox. At all!

Now in the final case, assume that production firms use bank loans to finance investment in addition to financing it via equities. The equations are:

WB + rmFD + Fb − C = ΔM + ΔE

Ff  = C I ΔIN  WB  rlL

ΔE =  ζΔL − FU

where 0 < ζ < 1 is that part of ΔL used for investment expenditure. In this case,

ΔIN + ζΔ= ΔM

So if households wish to hold more deposits, firms will switch to bank loans without any drop in inventories, output or expectations, with the qualification of course that bank credit is available.

Some have suggested (via Kalecki’s profit equation) that the paradox can be resolved only because of government deficits. This is not needed at all because there is no paradox. So around the turn of the millennium, the US government had its budget balance in surplus and the nation’s current account balance of international payments was in deficit over many quarters. Yet US firms made profits and were able to distribute them.

See the data below: the first one highlights in yellow the current account balance (line 42) and the budget balance (line 49) and also the fact that the financial balances of other sectors (lines 47/48) were low negative compared to profits numbers in question (source Z.1):

Flow of Funds, Table F.8

 (click to expand and click again)

the second one shows the net undistributed profits (undistributed profits less depreciation) (line 24), distributed profits (line 17) and depreciation (line 2) from which profits can be calculated, implying budget deficit and/or positive current account balance of payments is not needed to resolve the paradox of profits (because there is none to begin with).

Flow of Funds, Table S.5.a

 (click to expand and click again)

Of course, fiscal policy was tight around the time (although the budget balance is a poor measure of this) and this led to a fall in output soon, but that issue shouldn’t be confused with the paradox of profits.

Conclusion

One does not simply confuse operating surplus and surplus on the financial account of the system of national accounts. There is no resolution of the paradox of profits because there is none to begin with.

Description Of Cryptocurrencies Using SNA

In India – at least a while ago – they were many tickers trading on the stock exchanges with no income and in some cases with no office whatsoever!

Why would anyone incorporate such a thing? For two – illegal – reasons: first the IPO of the company gets the money in – which makes the owners rich – and the second way is to manipulate the price of the stock to fool more investors. The owners would trade among themselves and fool trend followers to buy the stock.

Cryptocurrencies are like that – with the difference being that they are equity liabilities of unincorporated and unregistered enterprises trading in unregulated markets. The deceit lies in marketing them as some sort of currency and inducing people to trade in them as if it were some currency.

If that is the case, what is the national accounts description (like the 2008 SNA) of such a thing? First, there is no incorporation so we have to treat them as quasi-corporations as national accountants do.

Sec 4.42 of the 2008 SNA has a description of quasi-corporations. That is for general economic activity but here I use the concept to describe cryptocurrencies. The difference here is that unlike the quasi-corporations, the cryptocurrency quasi-corp has no income!

The other reason for thinking of a quasi-corporation is that one usually sees money as a liability of an institution, so we need to think of cryptocurrencies as a liability of some economic unit.

So how does the balance sheet of this cryptocurrency quasi-corp look like at various stages?

Let us say that the cryptocurrency quasi-corporation raises $100mn at the “IPO”:

Assets

Liabilities and Net Worth

Bank Deposits = +$100mn

Equities Issued = +$100mn
Net Worth = $0

Note: Here the symbol $ is for the United States dollar and not for any cryptocurrency such as the bitcoin.

Now, the owners of the cryptocurrency quasi-corporation make a “withdrawal of equity”. That is, whatever money is received in ordinary currency is transferred to the owner’s personal account. After this, the balance sheet of the quasi-corporation looks like:

Assets

Liabilities and Net Worth

Bank Deposits = $0

Equities Issued = +$100mn
Net Worth = −$100mn

which has a counterpart that the owners’ net worth rises by $100mn (as a result of the transfer of payment received in dollars to the owners’ account).

Once the “cryptocurrency” starts trading in unregulated markets, the price of a unit rises or falls, so let’s say it rises 10 times the IPO price. At the time,

Assets

Liabilities and Net Worth

Bank Deposits = $0

Equities Issued = +$1bn
Net Worth = −$1bn

Of course, there is nothing wrong with the net worth of a corporation going negative – as may sometimes happen in times when there is a stock market boom, even for the corporate sector of a nation as a whole.

In this case however, this cryptocurrency quasi-corporation has no income whatsoever. In fact, it is using your services and hence making a loss which is covered by issuing more equities!

There is a concept of mining in cryptocurrency which is the most interesting part.

So suppose users “mine” cryptocurrency worth $100mn by providing services to the quasi-corporation, the balance sheet of the quasi-corporation will look like (assuming the price of the cryptocurrency hasn’t changed):

Assets

Liabilities and Net Worth

Bank Deposits = $0

Equities Issued = +$1.1bn
Net Worth = −$1.1bn

In the language of flows, the cryptocurrency quasi-corporation has:
an operating surplus of minus $100mn,
a balance of primary income of minus $100mn,
entrepreneurial income of minus $100mn,
disposable income of minus $100mn, and,
saving (undistributed profits) of minus $100mn.

This has a counterpart in the financial account as a net borrowing of $100mn by issuance of equities worth $100mn.

(For the above refer to the tables in Annex 2 – The Sequence of Accounts of the SNA).

The ultimate user of this intermediate consumption is another firm but the trick here is that its costs are reduced because of the issuance of cryptocurrencies for which it is not liable at all.

In the case where you own some cryptocurrency and pay for some pizza using it, it is a transaction between you and the pizza maker and shouldn’t affect the accounts of the quasi-corporation except the change in the name of ownership of the cryptocurrency – like a transaction using bank deposits. Here it is more like buying a pizza using Apple stocks with Apple Inc. acting as the settlement agent.

Of course, I repeat – currencies are not like equities but in this case, cryptocurrencies have been marketed as currencies whereas they are more like stock market equities but traded in unregulated markets.

The cryptocurrencies are thus a more sophisticated version of stocks of companies trading in markets with no income and no office.

Strange Claims About KfW

Earlier, I had two posts on this but now these have been merged into one. 

Chartalists again!

This blog post The fiscal role of the KfW – Part 1 by Bill Mitchell of Australia makes the most exorbitant claims about an institution called KfW and the government of Germany.

Bill Mitchell claims:

It is a major reason why the public debt ratio in Germany is 80 per cent rather than close to 100 per cent. It is a major reason why the federal deficit has been reduced without scorching the German economy. It is a story about smoke-and-mirrors accounting, German-style.

This is a bizarre claim. For Mitchell’s claim on the deficit to be valid, KfW should be a net borrower each year of a big size. For the claim on the public debt, KfW’s net indebtedness should be large. If Mitchell means anything other than this when saying “fiscal role”, what is it?

Unfortunately for Mitchell, KfW is a net lender to the private sector and the rest of the world sector in the flow sense and a net creditor in the stock sense.

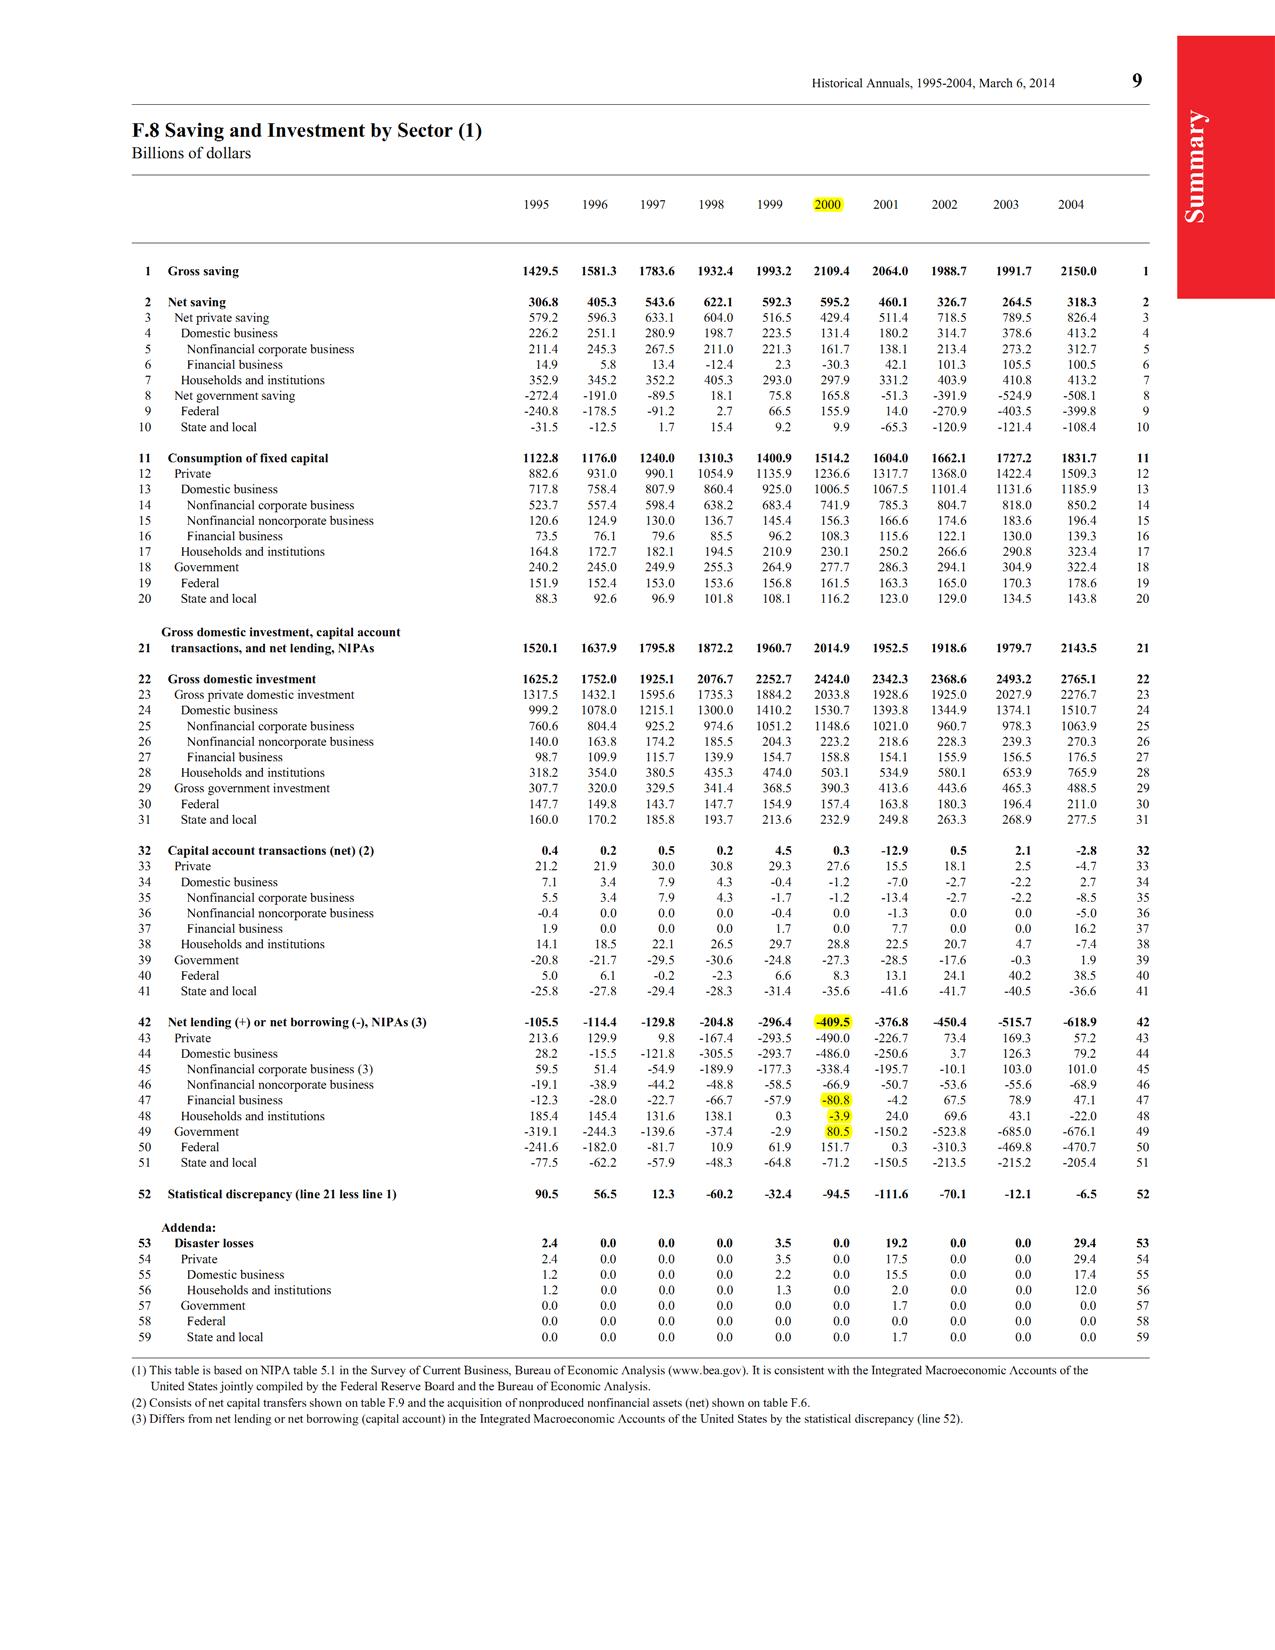
First, Germany’s 2012 GDP was €2.666tn (source: OECD.StatExtracts) and 1% of that is about  €26.66bn and 20% of GDP is €533bn.

Here’s the 2012 financial report of KfW.

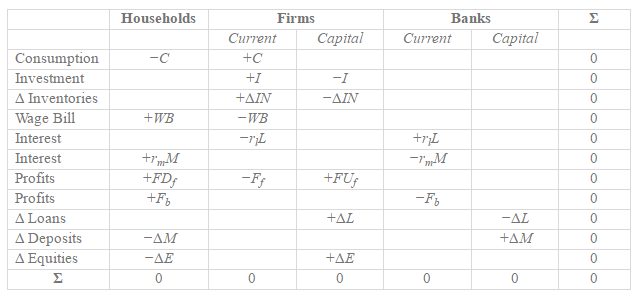
Let’s get an order of magnitude of the numbers. The net lending of KfW would identically be its undistributed profits minus capital expenditure. KfW doesn’t distribute profits (page 10 of the report) and so its undistributed profits is equal to its profits. Page 66 of the financial report says 2012 profits is €2.38bn and capital expenditure is negligible (page 72).

Hence KfW is a net lender and not a net borrower!

In other words, Prof. Mitchell seems to present a story in which the German government is using KfW as a tool to have a higher budget deficit than what it shows in its own books but it is in fact the opposite. This is because the combined entity KfW + Government of Germany has a lower deficit than the deficit of the government of Germany.

Moving to the balance sheet, its size is about €511bn – also quoted by Mitchell. But the size is not the main thing here. It is whether KfW is a net debtor or not. The balance sheet (page 68) says that equity is about €20.69bn. Of course, the item equity doesn’t by itself say anything about net indebtedness – an economic unit can possibly have a large net worth (in this case with no stock market shares issued, the same as equity) and yet be a net debtor if it holds a large proportion of its assets in non-financial form. The balance sheet however suggests that this is not the case – property, plant and equipment and intangible assets are small compared to other numbers.

Hence KfW is a net creditor and nothing like an institution with net indebtedness of about €533bn (100% minus 80% of GDP, see the quote at the start of this post.)

This was for 2012 but for other years just mirror the analysis – different numbers but of order of magnitude like these and nothing like what Prof. Mitchell interprets them to be. Supposedly, according to him, KfW

It spends, I mean lends millions each year at very low rates … pumps millions of Euros in the domestic economy and the export sector.

I suppose it subsidies lending and the fiscal part is how these subsidies are calculated and not the amount of lending which Mitchell seems to present by saying “pumps millions of Euros”. These lending flows are not like a government expenditure flow.

And spending is not lending!

In other words, the subsidy provided indirectly by the government via KfW. This can perhaps be estimated by the profits of a domestic bank of similar size or by some similar sort of comparison – and estimating what profits would have been otherwise. After this one would compare it to various numbers in the government budget. This however in my opinion will be nothing like what Mitchell makes it out to be.

Further Bill Mitchell makes another claim:

There are three reasons to look closely at the KfW:

1. It played a role in the Deutsche Telekom (so-called) privatisation, which helped the German government slip out of an embarassing excessive deficit procedure in 2004. Sleight-of-hand is the best description for what happened.

Except that there was no sleight-of-hand.

In national accounts such as in the 2008 SNA, items such as privatization appear in the financial account and perhaps sometimes in the “other changes in assets accounts”. This ECB Convergence Report June 2013, page 68, box 6 says:

a reduction in financial assets (as a result of privatisations for instance) tends to reduce the borrowing requirement as it generates cash, while leaving the deficit unchanged.

In other words, the privatization of Deutsche Telekom has no effect on the deficit. It reduces the public sector borrowing requirement and the public debt, but the private sector net worth doesn’t change at the time of the transaction. So it is not as if the private sector holds more of financial assets as a result of the privatization. It may see holding gains but that is a different matter.

At any rate, what would have been the alternative to bring the gross public debt down to meet the debt-deficit-criteria? Attempt to deflate German domestic demand and consequently demand and output in the rest of the Euro Area?

Also, even if one counts the effect of privatization in the deficit, it would have Germany’s deficit from 4.3% to 4.2%. As a commentator in Billy Blog writes:

Take for instance the purchase in November 2003, which according to you was done as a result of the pressure from the EU in reducing the deficit. The KfW purchased about 200 Million stocks, wow, sounds impressive… except the actual value of those stocks was only about 2.5 Billion €. The german deficit in 2003 was 89 Billion € or 4.2% of the GDP, so without the KwF buy it would have been… 4.3% (if you round up generously). The KfW buys and sells had no practical relevance for Germany either going below or above the deficit rule of the Growth and Stability Pact – the sums involved were simply not big enough for that.

Thus, the entire story about the supposed fiscal role of the KfW is incorrect.

More Strange Claims On KfW (10 Dec 2013)

Phil Pilkington writes in defense of Bill Mitchell in response to my previous post Strange Claims About KfW [Updated].

Pilkington’s errors are simple accounting errors and misunderstanding of flow-of-funds. Pilkington seems to assume the same logic of Mitchell. According to him:

The trick is that this borrowing doesn’t appear on the government balance sheet so, given a level of aggregate net expenditure equal to,

[Government Deficit + KfW Lending],

the Federal deficit is lower than it would otherwise be if the government had to foot the bill for all this expenditure.

First, the government would not have to “foot the bill for this expenditure” if it were to lend directly to the private sector on its books because the lending would not be “expenditure” but a loan by the government and it would be making a profit on it. The loan would not add to the budget balance even if the government were to directly lend. The expenditure would be for the firm using the proceeds of the loan and it is not public expenditure. Pilkington seems to confuse income/expenditure flows with financial flows. Or in the language of the 1993/2008 SNA confuses current accounts with the financial account.

In fact the profits if the government were to lend directly would reduce the federal deficit by a bit, not increase as claimed by Pilkington.

Further Pilkington seems to assume that another counter-factual in this case is less borrowing by the private sector and hence lesser private expenditure. No! this counter factual is the private sector borrowing from other banks – i.e, private banks. Why would German firms find difficulty in borrowing if they happened to show their creditworthiness to KfW?

Also, as I highlighted in the previous post, a proxy for the subsidy would be the profit of the bank of a similar size minus the actual profit of KfW. It is nothing like Mitchell’s rabble-rouse.

Balance Of Payments Crises

Phil Pilkington takes an issue with Sergio Cesaratto on the usage of the phrase “balance-of-payments crisis” on problems of the Euro Area.

Phil’s argument is that typically nations facing balance of payments problems need foreign currency and it manifests itself as a depreciation of the domestic currency but in the Euro Area this isn’t the case (because the exchange rates are fixed irrevocably between the Euro Area nations by the national central banks and the ECB). So the usage of the phrase “balance-of-payments crisis” is an abuse of language.

Now, to be short my argument that there is nothing wrong with the usage is because of the definition of what “balance-of-payments” actually is. Here is why:

A balance of payments transaction is a transaction between residents and non-residents. It is not relevant in which currency the transaction really is. So if you were a U.S. resident and if I as an Indian pay you $1 in New York in person, it is still a balance of payments transaction from the viewpoint of the United States. (of course if I own a firm in the United States which pays you then it is not a balance of payments transaction because the firm would be a resident).

In this way it becomes clear that some Euro Area nations have a balance of payments financing problem and since it reached a crisis level, the problem can be classified as a balance of payments crisis even though there is no exchange rate which has collapsed.

The nations which were/are in troubled had difficulties because they had huge current account deficits and as a result became indebted to the rest of the Euro Area. This became unsustainable and turned into a crisis. And both borrowers and lenders are to be blamed.

Since these nations had huge indebtedness to the rest of the Euro Area, they had troubles borrowing and refinancing their debts with foreigners and still have.

So I do not know why someone can take an issue with the phrase “balance-of-payments crisis”.

Except for the huge depreciation of the domestic currency, the Euro Area economic dynamics resembles a typical balance-of-payments crisis in all other ways. There is deflation of domestic demand, financial instability, high unemployment, increase in poverty and decrease in happiness and standard of living etc. There is international help in both cases.

Once again. A BoP transaction is between residents and non-residents. (See 2008 SNA, and BPM6 on this). A BoP crisis hence is a crisis in which borrowing and refinancing existing debt from non-residents has become difficult and is at crisis levels.  Whatever a country such as Portugal does at the moment, some units will be left indebted to the rest of the world/Euro Area. This is because liabilities are greater than financial assets and the difference is the net indebtedness to foreigners. Whatever new debts are created are equal in value to newly created financial assets. So the arithmetic dictates foreigners should be relied upon. The one qualification is that Portugal significantly improves its net exports but that is the same as saying its balance of payments is improving.

So anyone saying it is not a “balance-of-payments crisis” is fooling himself/herself.

United States To Adopt The 2008 SNA

There are two interesting articles in the Financial Times today:

Data shift to lift US economy 3% and US economy gets a Hollywood makeover

According to the first article,

The revision, equivalent to adding a country as big as Belgium to the estimated size of the world economy, will make the US one of the first adopters of a new international standard for GDP accounting.

which links to the 2008 SNA page.

The manual/handbook of the new SNA is available at the Unstats site.

It is also available in print for $150 or $75 (depending on where you live).

It is the book to learn national accounts and is better if read from the start rather than being used as a reference for one particular point.  When you read it patiently, you will realize how much of work and effort has gone into it – especially to make the conceptual framework self-consistent.

Random Tidbits On National Accounts And Keynesian Models Of Income And Expenditure

I came across this article (via a Tweet from Stephen Kinsella): Accounting As The Master Metaphor Of Economics by Arjo Klamer and Donald McCloskey which discusses how the framework of national accounts has been pushed to the background in economic analysis over the years.

It is a nice read – although boring in a few places. I found this reference to John Hicks’ 1942 book The Social Framework: An Introduction To Economics in the above article and managed to get a copy – although a used one but with almost no usage. As described in the Klamer-McCloskey’s article, Hicks’ textbook really goes into details of national accounts and he seems to have had a great intuition of how it all works.

John Hicks - The Social Framework

Hicks’s book gives a nice introduction to how important national accounts are in understanding and describing the production process and economic cycles.

Here is a scan of two pages on the balance of payments – the topic I like the most.

John Hicks Balance Of Payments

(click to enlarge)

Hicks understood how weak balance of payments can cause troubles. Of course, it took the genius of Nicholas Kaldor to realize the supreme importance of balance of payments in the determination of national income and expenditure. Leaving that aside, the text has nice ideas and discussions on how stocks and flows feed into one another.

John Hicks is famous for an entirely different reason – the IS/LM model. Later he accepted it was a huge mistake, but put it mildly: “… as time as gone on, I have myself become dissatisfied with it”. But economists still keep using it and keep erring.

Also, Hicks was to soon abandon/forget his own social accounting approach as per Klamer-McCloskey’s article. Perhaps, not really.

In an extremely important paper, Wynne Godley said:

To come down to it, the present paper claims to have made, so far as I know for the first time, a rigorous synthesis of the theory of credit and money creation with that of income determination in the (Cambridge) Keynesian tradition. My belief is that nothing the paper contains would have been surprising or new to, say, Kaldor, Hicks, Joan Robinson or Kahn.

John Hicks also had another nice book called A Market Theory Of Money written in 1989. Here is a great insight (also the view of Kaldor) from Page 11, Chapter 1 named “Supply And Demand?” on how to create a dynamic Keynesian theory of determination of national income and expenditure:

… The traditional view that market price is, at least in some way, determined by an equation of demand and supply had now to be given up. If demand and supply are interpreted, as had formerly seemed to be sufficient, as flow demands and supplies coming from outsiders, it is no longer true that there is any tendency over any particular period, for them to be equalized: a difference between them, if it were not too large, could be matched by a change in stocks. It is of course true that if no distinction is made between demand from stockholders and demand from outside the market, demand and supply in that inclusive sense  must be equal. But that equation is vacuous. It cannot be used to determine price, in Walras’ or Marshall’s manner. For what matters to the stockholder is the stock that he is holding: the increment in that stock, during a period is the difference between what is held at the end and what was held at the beginning, and the beginning stock is carried over from the past. So the demand-supply equation can only be used in a recursive manner, to determine a sequence (It is a difference or a differential equation); it cannot be used directly to determine price, as Walras and Marshall had used it.

I came across a reference in the book (The Social Framework) to a paper by James Meade and Richard Stone on concepts on national accounts: The Construction Of Tables Of National Income, Expenditure, Savings And Investment written in 1941. It has the following interesting table:

James Meade & Richard Stone - Sectoral Balances

which is the now famous sectoral balances identity! Incidentally, it also includes Kalecki’s profit equation. In the above “Foreign Investment” shouldn’t be confused with Foreign Direct Investment flows in the financial account of the balance of payments. The authors define it as:

… equal to income generated by receipts from abroad less current expenditure abroad.

So can we call the profit equation SMK equation? 🙂

James Meade and Richard Stone were pioneers of national accounts. Incidentally, James Meade wrote a famous textbook on balance of payments.

Of course the way this is presented doesn’t make the connection between the financial account and current accounts. The sectoral balances was usually written by Wynne Godley as:

NAFA = PSBR + BP

where NAFA is the net accumulation of financial assets of the private sector, PSBR is the net public sector borrowing requirement, and BP is the current account balance of international payments. More on this connection below.

How it is to be derived in a stock-flow consistent framwork of Godley/Lavoie? If you click on this search Transactions Flow Matrix, you will find some blog posts on the background. First, we construct a flow matrix like this:

Simplified National Income Matrix

The last line is essentially Kalecki’s profit equation.

The above construction however raises an important question. Godley and Lavoie’s textbook (Chapter 2) quotes a famous 1949 article of Morris Copeland on this:

When total purchases of our national product increase, where does the money come from to finance them? When purchases of our national product decline, what becomes of the money that is not spent?

Copeland’s work was highly successful and established the flow of funds accounts of the United States in 1952.

Here is a republished version of the article (via Google Books):

click to preview on Google Books’ site

Incidentally, Copeland was motivated to prove the quantity theory of money wrong when he did this work! Also Godley/Lavoie point out that John Dawson (the editor of the above book) says:

the acceptance of…flow-of-funds accounting by academic economists has been an uphill battle because its implications run counter to a number of doctrines deeply embedded in the minds of economists.

in an article from the chapter The Conceptual Relation Of Flow-Of-Funds Accounts To The SNA of the same book.

Over time, the system of national accounts (with its first version in 1947) has used some of the concepts of flow of funds accounting and now the framework is much more wider than usual textbook guides of national accounts. The flow of funds still retains importance because it has information which the system of national accounts such as (2008 SNA) doesn’t handle.

Here’s the UN website for the historical versions of the system of national accounts.

How does one look at this in a stock-flow coherent framework? Simple, we need a full transactions flow matrix – which not only includes income/expenditure flows but also financial flows. The following is how it looks like for a simple model:

Transactions Flow Matrix 3

(Click to zoom)

Of course, identities themselves shouldn’t be looked at as models. One needs a fully coherent accounting model of the economy based on behavioural assumptions and “closures”. See this essay Keynesian theorising during hard times: stock-flow consistent models as an unexplored ‘frontier’ of Keynesian macroeconomics Camb. J. Econ. (July 2006) 30(4): 541-565 by Claudio Dos Santos and also Wynne Godley and Marc Lavoie’s book Monetary Economics. As Dos Santos quotes Lance Taylor in the article:

Formally, prescribing a closure boils down to stating which variables are endogenous or exogenous in an equation system largely based upon macroeconomic accounting identities, and figuring out how they influence one another.

A Quiz On National Accounts: Answers

In my previous post, I had the following questions:

  1. Can government expenditure be greater than 100% of gdp?
  2. Can Gross Fixed Capital Formation of an economy as a whole be negative?

The answer to both is yes. Commenters guessed the right answer and provided the example I was looking for (except the fourth below).

Here are examples to illustrate:

Government Expenditure

  • Open Economy: Imagine a small economy with a gdp of $1bn equivalent (easier to visualize than the United States with a gdp of $15tn having government expenditure greater than 100% of gdp). The government in one accounting period purchases weapons from abroad worth $2bn (maybe by sale of reserve assets or by increasing liabilities: irrelevant).
  • Closed Economy: Imagine if the government makes large transfers to households who are reducing spending drastically due to increasing uncertainties. They may eventually spend, but that’s eventually. For the accounting period, government expenditure can be large in principle than gdp. Remember, the p in gdp is for product(ion) and the standard formula “GDP = C + I + G” assumes that the government expenditure is for purchase of output and is not making transfers.

Gross Fixed Capital Formation

  • Open Economy: It’s a small economy with the private sector having few firms selling aircrafts abroad. During one period (such as a quarter), firms sell a lot of aircrafts – produced earlier – to the rest of the world and this makes the gross fixed capital formation negative.
  • Closed Economy: A bit more implausible than the above there examples but at least mathematically possible and that was what the question was. The example is firms selling huge amount of used cars to households. For households this is consumption and not capital formation. For firms, it is negative capital formation because cars used by firms is used in the production process and is counted as their fixed capital.

Of course, in the examples I ignore consequences (positive or negative) that may happen later.