Tag Archives: 2008 SNA

Link

New UK Flow Of Funds

The UK Office Of National Statistics (ONS) is planning to publish new flow of funds statistics in the future. Till now, the ONS had just the SNA tables. Although the SNA has lots of details on stocks and flows, flow of funds gives more details.

ONS summary:

See our first combined set of experimental flow of funds statistics using new data sources providing improved breakdowns of how money moves around the UK economy

The article also has a discussion on sectoral balances which has the chart on top of this post.

The 2008 SNA explains this:

Measuring Global Production And Competitiveness

Imagine a firm F1 in the United States 🇺🇸, which sells, say, toys. The firm is solely American, insofar as the employees of this firm and factory location are concerned. But the firm also exports toys and this contributes to the United States’ exports. For simplicity, assume that raw materials aren’t imported from abroad. Let’s say sales is $120 million of which exports are $100 million.

Now, imagine the firm has offshored significant part of its production to, say, Taiwan 🇹🇼. In other words, there’s a firm F2 in Taiwan owned by significantly by F1. This gives a cost advantage to F1 and let’s say the sales are $200 million outside the U.S. and $40 million in the US.

The way the system of national accounts and balance of payments guide, i.e., the 2008 SNA and BPM6 treat these two cases are different.

Exports of the United States is $100 million in the first case but not $200 million in the second.

This is because—and I am simplifying here—the toys are manufactured by F2, which is a resident of Taiwan and the goods sold in the rest of the world (rest in relation to the United States) is between a resident unit of Taiwan and the rest of the world.

In addition, there’s a significant transfer of resources from F1 to F2 and this is captured using the concept of transfer pricing.

Of course, this doesn’t mean that these sales don’t affect the United States’ balance of payments. Remember how the current, capital and financial accounts look:

source: IMF, BPM6

In the first case, only the goods line in exports is affected in the current account.

In the second case, goods and services (transfer of resources from F1 to F2), distributed income of corporations and retained earnings are all affected.

Goods, because of transfer of some goods from F1 to F2. Also because consumers inside the United States may buy the toys.

Services, because of use of intellectual property of F1 by F2. 

Distributed income of corporations and retained earnings because F1 is a direct investor in F2.

So in our example, in the second case, the sale of toys to the the world affects exports, imports and primary income in the balance of payments.

So what was $100 million of exports could be $30 million of exports when production is offshored, whereas $200 million is more intuitive.

In other words, the goods and services balance (or the trade surplus, or the negative of the trade deficit) is changed.

So the change in the U.S. goods and services balance of payments is attributable to three things:

  1. Change in competitiveness of American firms,
  2. Changes in accounting treatment because of offshoring,
  3. Transfer pricing.

The UN 🇺🇳 guideGuide To Measuring Global Production is a good reference for this.

It explains complications because of transfer pricing:

Transfer pricing

3.40 The Organisation for Economic Co-operation and Development (OECD) (2010) guidance on transfer pricing13 introduced a series of guidelines that may assist MNEs and national tax authorities in using transfer prices to value intra-firm transactions and to evaluate their appropriateness for taxation purposes. The guidelines insist that intra-firm transactions are priced, as far as possible, like arm’s length transactions between unrelated third parties. The guidelines give recommendations on how these intra-firm transactions can be analyzed to determine if they meet these requirements. These recommendations cover comparable measures of profits or comparable measures of costs to be used in assessing transactions between firms.

3.41 In this context recent developments at OECD have resulted in a series of steps to be followed by member countries to limit the impact of Base Erosion and Profit Shifting (BEPS)14. These steps will require transparency, exchange of information between taxation authorities and general cooperation to ensure the arm’s length principle is followed in transactions between entities in an MNE group.

3.42 Nevertheless, distortions in the use of the arm’s length principle are not always tax driven. The 2008 SNA (paragraph 3.133) explains that the exchange of goods between affiliated enterprises may often be one that does not occur between independent parties (for example, specialized components that are usable only when incorporated in a finished product). Similarly, the exchange of services, such as management services and technical know-how, may have no near equivalents in the types of transactions in services that usually take place between independent parties. Thus, for transactions between affiliated parties, the determination of values comparable to market values may be difficult, and compilers may have no choice other than to accept valuations based on explicit costs incurred in production or any other values assigned by the enterprise.

3.43 The 2008 SNA explains that replacing book values based on transfer pricing with market value equivalents is perhaps desirable in principle but is an exercise calling for cautious and informed judgment. One would expect such adjustments to be enforced in the first place by the tax authorities.

13 Transfer Pricing Guidelines for Multinational Enterprises and Tax Administrations: www.oecd.org/ctp/transferpricing/transfer-pricing-guidelines.htm

14 http://www.oecd.org/tax/beps.htm

The guide has 175 pages, so it’s very complicated!!

Again, distortions in transfer pricing isn’t the only thing. Even if it is captured properly, the mere act of offshoring changes the goods and services account numbers.

To summarize, there are two important issues here:

  1. Measurement issues for national accountants,
  2. Need for economists to understand the accounting behind all this.

So one could say that U.S. trade balance isn’t as bad as it seems, because a lot is captured in primary income account of balance of payments instead of the goods and services account. It might also partly explain why the U.S. primary income balance is so large. It should however be noted that there’s a cancelling effect in the current account and current account balance which is equally important.

The post was motivated by a tweet by Brad Setser.

Do Bank Recapitalisation By The Government Lead To Higher Fiscal Deficits?

Yesterday, the Indian government announced a $32 billion plan to recapitalise some banks. These banks have large government ownership. Such issues remain controversial because the government is seen as allowing a lot of bank debtors get away with defaulting on their loans. At any rate, the topic for this post is whether the government plan leads to a rise in deficit or not.

The Chief Economic Advisor clarified on Twitter than according to international standards, it doesn’t lead to a rise in fiscal deficits over the periods during which recapitalisation happens. But people don’t seem to be convinced. So here’s an attempt.

In short, a recapitalisation of banks by the government by an amount of say $100 doesn’t lead to an increase of $100 in deficit. There are some complications, as highlighted below.

It shouldn’t matter but those arguing whether it leads to a rise in deficits are motivated to do so since acceptance by the government will lead to a fall in government expenditures since they are—incorrectly—committed to “fiscal responsibility”.

In the system of national accounts—the latest update of which is the 2008 SNA—there are three main types accounts in the transactions flow account:

  1. Current accounts
  2. Capital account
  3. Financial account

The current accounts record things such as production, generation and distribution of income and so on.

The capital account records transactions in non-financial assets. Para 10.1 of the 2008 SNA describes it:

The capital account is the first of four accounts dealing with changes in the values of assets held by institutional units. It records transactions in non-financial assets. The financial account records transactions in financial assets and liabilities. The other changes in the volume of assets account records changes in the value of both non-financial and financial assets that result from neither transactions nor price changes. The effects of price changes are recorded in the revaluation account. These four accounts enable the change in the net worth of an institutional unit or sector between the beginning and end of the accounting period to be decomposed into its constituent elements by recording all changes in the prices and volumes of assets, whether resulting from transactions or not. The impact of all four accounts is brought together in the balance sheets. The immediately following chapters describe the other accounts just mentioned.

[emphasis: mine]

The financial account is described in para 11.1:

The financial account is the final account in the full sequence of accounts that records transactions between institutional units. Net saving is the balancing item of the use of income accounts, and net saving plus net capital transfers receivable or payable can be used to accumulate non-financial assets. If they are not exhausted in this way, the resulting surplus is called net lending. Alternatively, if net saving and capital transfers are not sufficient to cover the net accumulation of non-financial assets, the resulting deficit is called net borrowing. This surplus or deficit, net lending or net borrowing, is the balancing item that is carried forward from the capital account into the financial account. The financial account does not have a balancing item that is carried forward to another account, as has been the case with all the accounts discussed in previous chapters. It simply explains how net lending or net borrowing is effected by means of changes in holdings of financial assets and liabilities. The sum of these changes is conceptually equal in magnitude, but on the opposite side of the account, to the balancing item of the capital account.

[emphasis: mine]

A recapitalisation of banks is an exchange for equities issued by the bank for funds. The government might raise funds via auctions. The Indian government is even planning to issue something called “recapitalisation bonds” which will be a direct exchange of those bonds with banks for equity. At any rate, these transactions for the government are likely to change the financial account and won’t enter the current accounts and the capital account. So these don’t change the deficit, with the exception below.

It could be the case that the purchase of equity by the government could be not at the market value. So there’s something called capital transfers.

There was a good publication by the BEA which appeared in the Survey of Current Business, February 2009. 

click for the pdf file

So the note says:

… consistent with the recommendations in the newly updated international guidelines, System of National Accounts 2008 (SNA), in the fourth quarter of 2008, BEA recorded a portion of the purchase of preferred stock through the TARP as capital transfers; this portion was calculated as the difference between the actual prices paid for the financial assets and an estimate of their market value. These capital transfers recognize that the federal government paid over market value for these financial assets. Net government saving was not affected by the capital transfers, but net government lending or borrowing was reduced as shown in NIPA tables 3.1 and 3.2.

So the full amount of the recapitalisation doesn’t affect the deficit.

In other words, government recapitalisation of banks for an amount $100 doesn’t increase the deficit by $100, but only by the amount mentioned above.

There’s a technicality. If a bank is fully government owned, then it’s the case that the full amount of recapitalisation is the capital transfer. Else it is not.

Also, once a bank is recapitalised, the government pays interest on the bonds and also receives dividends from the ownership. These affect the deficit, and the numbers are also different to the case when a bank isn’t recapitalised or recapitalised by the markets. But for the current purpose, it’s not that important.

It should be simple to understand. If you borrow to buy financial securities for $100, it doesn’t change your deficit or net borrowing (except for brokerage fees and transaction taxes). Your net lending is the difference between your disposable income and expenditure on goods and services. You have borrowed to buy some financial securities but you are also a lender.

Anyway, this simple point was missed even by the US Treasury!

Economics Without Mathematics?

Recently, Noah Smith wrote an article for Bloomberg View, titled Economics Without Math Is Trendy, But It Doesn’t Add Up.

Smith’s attitude is the following:

  1. Heterodox economics is vague and neoclassical economists are mathematical geniuses.
  2. Heterodox authors somehow manage to sneak in some model of the economy.

How about something opposite? That stock flow consistent/coherent models come close to describing the real world and neoclassical models don’t even start in the right foot? The usage of mathematics in neoclassical economics looks silly to me to say the least. Heterodox authors on the other hand have made important breakthroughs with stock-flow consistent models. In these models, the description of how stocks and flows affect each other leading to macrodynamics describing the real world is obtained.

Neoclassical models (which the phrase I use for the “new consensus”) not only doesn’t have anything as mathematical as this but it fails in the first place to identify the correct tools to describe economic behaviour.

Morris Copeland writing in Social Accounting For Moneyflows in Flow-of-Funds Analysis: A Handbook for Practitioners (1996) [article originally published in 1949] said:

The subject of money, credit and moneyflows is a highly technical one, but it is also one that has a wide popular appeal. For centuries it has attracted quacks as well as serious students, and there has too often been difficulty in distinguishing a widely held popular belief from a completely formulated and tested scientific hypothesis.

I have said that the subject of money and moneyflows lends itself to a social accounting approach. Let me go one step farther. I am convinced that only with such an approach will economists be able to rid this subject of the quackery and misconceptions that have hitherto been prevalent in it.

Morris Copeland’s work is what led the U.S. flow of funds which is published by the Federal Reserve every quarter. National accounts have also improved since their first version to incorporate Copeland’s ideas. See the 2008 SNA and the Balance of Payments And International Investment Position Manual, Sixth Edition for example.

Apart from stock-flow consistent/coherent models, models of the economy don’t even come close to describing the economy, because they miss the most important aspect: flow of funds.

So Goldman Sachs’ chief economist, Jan Hatzius for example uses this approach. See his paper The Private Sector Deficit Meets The GSFCI : A Financial Balances Model Of The US Economy, Global Economics Paper No. 98, Goldman Sachs, Sep 18, 2003.

So it is not that neoclassical economists have great mathematical tools. It’s that by failing to incorporate the framework of flow of funds, they are showing their incompetence in mathematical reasoning.

We Don’t Need No Helicopters … Hey! Economists! Leave Fiscal Policy Alone

A lot has been written on helicopter money recently. Most of them bad with a few exceptions such as one by JKH.

In my opinion, the main reason economists come up with stories such as “helicopter money” etc. is that it is difficult in standard economic theory to introduce money.

Few quotes from Mervyn King’s book The End of Alchemy: Money, Banking, and the Future of the Global Economy:

But my experience at the Bank also revealed the inadequacies of the ‘models’ – whether verbal descriptions or mathematical equations  – used by economists to explain swings in total spending and production. In particular such models say nothing about the importance of money and banks and the panoply of financial markets that feature prominently in newspapers and on our television screens. Is there a fundamental weakness in the intellectual economic framework underpinning contemporary thinking? [p 7]

For over two centuries, economists have struggled to provide a rigorous theoretical basis for the role of money, and have largely failed. It is a striking fact that as as economics has become more and more sophisticated, it has had less and less to say about money… As the emininent Cambridge economist, and late Professor Frank Hahn, wrote: ‘the most serious challenge that the existence of money poses to the theorist is this: the best developed model of the economy cannot find room for it’.

Why is modern economics unable to explain why money exists? It is the result of a particular view of competitive markets. Adam Smith’s ‘invisible hand’ …

… Money has no place in an economy with the grand auction. [pp 78-80]

But the ex-Bank of England governor perhaps never worked with stock flow consistent models. The advantage of these models is that what money is and how it is created is central to the question of how economies work. The framework used in stock flow consistent models is not new exactly. What’s new in stock-flow consistent models is the behavioural analysis on top of the existing framework the system of national accounts and flow of funds. As Morris Copeland, who formulated the flow of funds accounts of the U.S. economy said:

The subject of money, credit and moneyflows is a highly technical one, but it is also one that has a wide popular appeal. For centuries it has attracted quacks as well as serious students, and there has too often been difficulty in distinguishing a widely held popular belief from a completely formulated and tested scientific hypothesis.

I have said that the subject of money and moneyflows lends itself to a social accounting approach. Let me go one step farther. I am convinced that only with such an approach will economists be able to rid this subject of the quackery and misconceptions that have hitherto been prevalent in it.

– Morris Copeland, Social Accounting For Moneyflows in Flow-of-Funds Analysis: A Handbook for Practitioners (1996) [article originally published in 1949]

So what do we mean by helicopter money and it is really needed or useful? For that we need to go into a bit into some behavioural equations in stock-flow consistent models. One way is to use a somewhat simplified notation from Tobin’s nobel prize lecture Money and Finance in the Macroeconomic Process. In Tobin’s analysis, the government’s fiscal deficit is financed by high-powered money and government bonds:

GT = ΔH + ΔB

ΔH = γH·(G – T)

ΔB = γB·(G – T)

 γ+ γ= 1

0 ≤  γH, γB  ≤ 1

So the deficit is financed by “high-powered money” (H) and government bonds (B) in proportion γand γB

Now it is important to go into a bit of technicalities. Prior to 2008, central banks implemented monetary policy by a corridor system. After 2008, when the financial system needed to be rescued and later when central banks started the large scale asset purchase program (“QE”), central banks shifted to a floor system.

Although economics textbooks keep claiming that the central bank “controls the money supply”, in reality they are just setting interest rates.

In the corridor system, there are three important rates:

  1. The deposit rate: The rate at which central banks pay interest on banks’ deposits (reserves) with them,
  2. The target rate: The rate which the central bank is targeting, and is typically the rate at which banks borrow from each other, overnight, at the end of the day.
  3. The lending rate: The rate at which the central bank will lend to banks overnight.

There are many complications but the above is for simplicity. Typically the target rate is mid-way between the lower (deposit rate) and the higher (lending rate).

In the floor system, the government and the central bank cannot set the overnight at the target rate if the central bank doesn’t supply as much reserves as demanded by banks. Else the interest rate will fall to the deposit rate or rise to the lending rate. In a system with a “reserve-requirement”, banks will need an amount of reserves deposited at the central bank equal to a fraction of deposits of non-banks at banks.

So,

H = ρ·M

where M is deposits of non-banks at banks and ρ is the reserve requirement. In stock-flow consistent models, is endogenous and cannot be set by the central bank. Hence is also endogenous.

In the floor system, the target rate is the rate at which the central bank pays interest on deposits. Hence the name “floor”. There are some additional complications for the Eurosystem, but let’s not go into that and work in this simplification.

In the floor system, the central bank and the government can decide the proportions in which deficit is financed between high powered money  and government bonds. However since deposits are endogenous the relation between high powered money and deposits no longer holds.

In short,

In a corridor system, γand γB are endogenous, M is endogenous and H = ρ·M. In a floor system, γand γB can be made exogenous, M is endogenous and H ≠ ρ·M. is not controlled by the central bank or the government in either cases and is determined by asset allocation decisions of the non-bank sector.

Of course, the government deficit Gitself is endogenous and we should treat the government expenditure G and the tax-rates θ as exogenous not the deficit itself.

So we can give some meaning to “helicopter money”. It’s when the central bank is implementing monetary policy by a floor system and γand γB are exogenous.

But this doesn’t end there. there are people such as Ben Bernanke who have even proposed that the central bank credit government’s account with some amount and let it spend. So this introduces a new variable and let’s call it Gcb.

So we have a corridor system with variables G and θ versus a floor system with variables G’G’cbθ,  γ’and γ’B

The question then is how is the latter more superior. Surely the output or GDP of an economy is different in the two cases. However people constantly arguing the case for “helicopter money” are in the illusion that the latter case is somewhat superior. Why for example isn’t the vanilla case of a corridor system with higher government expenditure worse than “helicopter money”.

Also it effectively reduces to a fiscal expansion combined with a large scale asset purchase program of the central bank (“QE”). I described QE’s effect here. Roughly it works by a wealth effect on output with some effect on investment via asset allocation.

To summarize, the effect on output by these crazy ways can be achieved by a higher fiscal expansion. There’s hardly a need to bring in helicopters. Some defenders say that it is faster but that just sounds like an excuse to not educate policymakers.

Monetary Mysticism

Normally, I’d give such things a pass. But there are monetary mysticists – the Neochartalists (“MMTers”) – who make a big issue of a few monetary things. In a post on banking, Eric Tymoigne such mystical things:

Throughout this blog I will not the use the words “loan” “lender” “borrower” “lending” “borrowing” when analyzing banks (private or Fed) and their operations. Banks don’t lend money, and customer don’t borrow money from banks. Words like “advance” “creditor” “debtor” are more appropriate words to describe what goes on in banking operations.

The word “lend” (and so “borrow”) is really a misnomer that has the potential of confusing—and actually does confuse—people about what banks do.

So banks do not make loans?

But that’s not the main point in my post. It is the other claim:

  • Point 2: The Fed does not earn any money in USD

When the Fed receives a net income in USD it is not receiving any money/cash flow, i.e. its asset side is not going up. What goes up is net worth.

[highlighting: mine]

Such things are also closely related to claims by the Neochartalists that “taxes don’t fund government expenditure” or “taxes don’t fund anything”. The claim “the Fed does not earn any money in USD” is quite silly.

If you were to ever do an honest-to-goodness calculations with such things, you’ll notice that items accounts receivable and accounts payable are important things. In the simplest example, the Federal Reserve holds government bonds as assets and has bank reserves or settlement balances of banks and currency notes on liabilities. So the Fed is accruing interest on bonds it holds and has payables on interest on banks’ settlement balances. The system of national accounts 2008, has a nice explanation on para 7.115:

The accrual basis of recording

Interest is recorded on an accrual basis, that is, interest is recorded as accruing continuously over time to the creditor on the amount of principal outstanding. The interest accruing is the amount receivable by the creditor and payable by the debtor. It may differ not only from the amount of interest actually paid during a given period but also the amount due to be paid within the period.

So the Federal Reserve’s assets can indeed go up along with net worth because of interest income. It will reflect in accounts receivable in assets. When an actual interest payment is received, it is a transaction in the financial account of the system of national accounts. Then, accounts receivable falls and so do liabilities but net worth doesn’t change. More generally, the Fed may also make advances to banks as the banking system as a whole can lose reserves for paying interest. There is absolute no need for the kind of mysticism that Neochartalists do.

The Phrase “Financial Intermediary” In National Accounts

A lot of times heterodox economists and bloggers complain about the usage of the phrase “financial intermediary” when talking about banks. Such as this one from 2016. The reason given is: “because loans make deposits”. In my opinion, this is counter-productive. While it’s true loans make deposits, it is irrelevant to whether banks should be termed financial intermediaries or not. In fact, that is standard usage. The System of National Accounts 2008, on para 4.101 says:

Financial corporations can be divided into three broad classes namely, financial intermediaries, financial auxiliaries and other financial corporations. Financial intermediaries are institutional units that incur liabilities on their own account for the purpose of acquiring financial assets by engaging in financial transactions on the market. They include insurance corporations and pension funds. Financial auxiliaries are institutional units principally engaged in serving financial markets, but do not take ownership of the financial assets and liabilities they handle. Other financial corporations are institutional units providing financial services, where most of their assets or liabilities are not available on open financial markets.

[italics and boldening in original]

Further 4.106 says:

In general, the following financial intermediaries are classified in this subsector:

a. Commercial banks, “universal” banks, “all-purpose” banks;

b. Savings banks (including trustee savings banks and savings and loan associations);

c. Post office giro institutions, post banks, giro banks;

d. Rural credit banks, agricultural credit banks;

e. cooperative credit banks, credit unions; and

f. Specialized banks or other financial corporations if they take deposits or issue close substitutes for deposits.

Heterodox economists use national accounts and flow of funds more often than orthodox economists who build their theory around a production function, so it is surprising that they vehemently oppose the usage of the phrase “intermediary” for banks. More importantly, the debate is not just semantics but also about “aggregate demand”. The ones who dislike the phrase “intermediary” seem to think that non-bank lending doesn’t have effects on aggregate demand. Funnily, while asserting others use the “loanble funds model”, they are themselves making such errors in their mental model.

Perhaps the term “financial intermediary” is used in the national accounts because it is centred around the production process. At the same time – of course – attention is equally given to finance. So there is nothing really to gain by trying to ban the usage of the phrase “intermediary” for banks.

Aside: IE users should upgrade their browser to IE11. 

Microsoft is going to stop support for old IE browsers. From now on, it will support the latest version only, unlike earlier when it was supporting several versions simultaeneously. So using old browsers will expose you to security risks. Websites’ codes are also browser dependent, so it is possible that my site won’t work with old IE soon. So please upgrade to IE11.

Or do something geeky. Pick up Chrome Canary or the Firefox Nightly build. But IE11 is not bad. It’s superfast.

Happy New Year!

United States’ Net Wealth, Part 2

This is a continuation of my previous post, United States’ Net Wealth. There I pointed out a new table which has been included in the Federal Reserve Statistical Release Z.1, Financial Accounts of the United States – Flow of Funds, Balance Sheets and Integrated Macroeconomic Accounts. This table in flow of funds report is B.1: Derivation of U.S. Net Wealth.

In the meanwhile, the Federal Reserve has released a note U.S. Net Wealth in the Financial Accounts of the United States which is worth your time.

In the note, the authors detail about the meaning of the measure of the “U.S. Net Wealth.” The definition is similar to the System of National Accounts 2008 (2008 SNA). The net worth of a nation is the sum of non-financial assets plus the net international investment position. The note says:

In estimating U.S. net wealth, we use direct measures of the value of households’, nonprofits’, noncorproate businesses’, and governments’ nonfinancial wealth. For corporate businesses, we use the market value of their outstanding equity shares to better capture the value of intangible assets, such as intellectual property. We then net out financial obligations between U.S. resident households, businesses, and government agencies and the rest of the world, because the concept of U.S. net wealth should exclude nonfinancial assets that are financed abroad rather than domestically, and include the value of nonfinancial wealth held by U.S. entities abroad. Taking all this together, we define net U.S wealth as the value of tangible assets controlled by households and nonprofits, noncorporate business, and government sectors of the U.S. economy, plus the market value of domestic nonfinancial and financial corporations, net of U.S. financial obligations to the rest of the world.

[emphasis, boldening: mine]

So what table B.1 does is that it uses non-financial assets for all sectors except when shares of companies are publicly traded.

There is however an issue here. Value of equities outstanding needn’t be a good measure. This is because firms issue both debt and equity. Imagine the case of a corporation which has a debt/equity mixture of 9:1.

Suppose the balance sheet is like this (in the SNA/IMA format):

Assets
Non-financial assets: $1 bn

Liabilities and Net Worth
Market value of bonds issued: $900 mn
Market value of equities issued: $90 mn
Net Worth: $10 mn

I am assuming that “non-financial assets” is the correct value of both tangibles and intangibles, which is $1bn here. But because of debt securities, the value of equities ($90 mn) is highly unlikely to touch $1bn. In other words, the total outstanding value of equities issued by the corporation is hardly a measure of non-financial assets in this case. Applying this idea further, it can be concluded that we need to keep track of the debt securities of the corporation as well. In summary, table B.1 needs to be updated conceptually.

United States’ Net Wealth

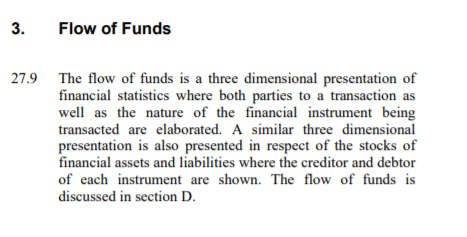
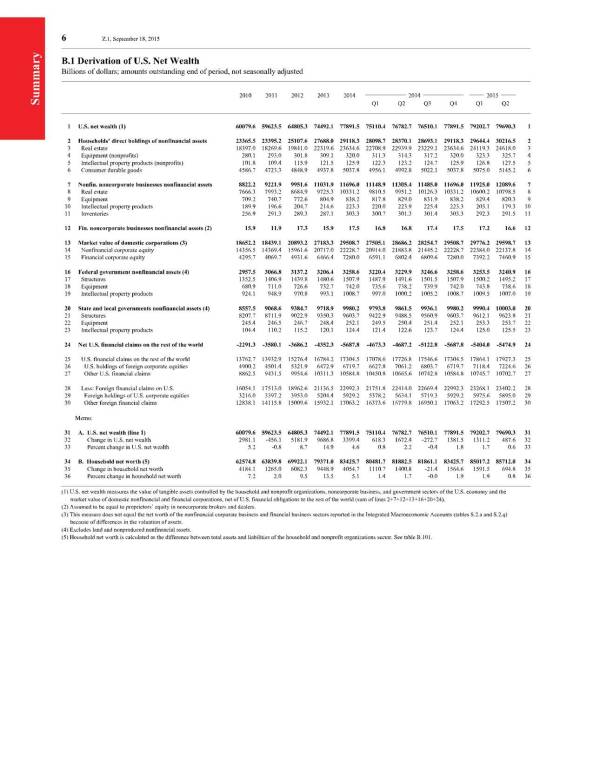
The latest release of the Federal Reserve Statistical Release Z.1, Financial Accounts of the United States – Flow of Funds, Balance Sheets and Integrated Macroeconomic Accounts or just “flow of funds” has a new table B.1: Derivation of U.S. Net Wealth.

According to the release:

A new table on the derivation of U.S. net wealth (table B.1) has been added to the summary section of the “Financial Accounts.” The calculation of U.S. net wealth includes the value of nonfinancial assets (real estate, equipment, intellectual property products, consumer durables, and inventories) held by households and nonprofit organizations and noncorporate businesses. For the federal government and state and local governments sectors, only structures, equipment, and intellectual property products are included; values for land and nonproduced nonfinancial assets are not available. The measure of U.S. net wealth also includes the market value of domestic nonfinancial and financial corporations, and is adjusted to reflect net U.S. financial claims on the rest of the world. This definition of U.S. net wealth differs from the sum of the net worth of sectors shown in the Integrated Macroeconomic Accounts (IMA). A forthcoming FEDS Note will provide additional information.

United States Net Worth

click to expand, and click again to zoom

According to it, the United States net wealth was $79.69 trillion.

It’s important to understand how this is reached. Normally we divide the world in various sectors: households, production firms, the financial sector, government and the rest of the world. In real life one adds more nuances to all this. So for example, in the table above, we have a sector “non-financial non-corporate businesses”.

Now, there are two types of assets: non-financial assets and financial assets. Non-financial assets are things such as houses, machines and so on. Financial assets are things such as currency notes, bonds, equity securities and so on.

In the system of national accounts (e.g., the 2008 SNA), all financial assets have a counterpart liability. So financial assets = liabilities for the world as a whole. It’s of course not true for a nation because assets and liabilities between residents and non-residents do not cancel out.

There is one complication, however: equity securities. The 2008 SNA treats equity securities as liabilities of corporations, just like debt securities. This is despite the fact that a company isn’t bound by law to pay dividends to holders of equity, unlike the case for debt securities or loans (for which interest is needed to be paid periodically and also the principal upon maturity).

All economic units have a net worth. This is the difference between assets and liabilities. So,

Assets = Liabilities + Net Worth.

Since equities are treated as liabilities in the 2008 SNA, the net worth of firms can in fact turn negative. This might happen if the price of equities is high.

So it is easy to derive the net worth of a nation. Resident economic units’ liabilities held by resident economic units cancel out and one is left with non-resident units’ liabilities to residents (i.e., resident units’ assets “held abroad”) and residents’ liabilities to non-residents.  This is the net international investment position.

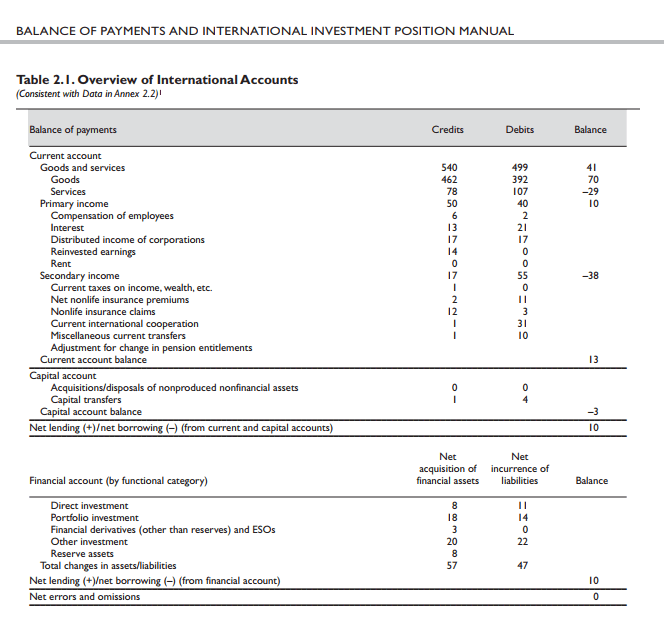
So, as per the 2008 SNA (and the Balance of Payments Manual, 6th Edition),

Net Worth of a nation = Non-financial assets held by residents + Net International Investment Position

The Federal Reserve however does not do the same for flow of funds. It does not treat equities as liabilities.

But one has to be careful about double counting. It’s easy to sum up non-financial assets of all economic units, such as as done by the SNA. But in the flow of funds, with the special treatment on equities, we shouldn’t use corporate businesses’ non-financial assets. If you read the explanation and see the table B.1 carefully, corporate businesses’ assets have not been added, only “non-corporate businesses'” non-financial assets have been added. Since equities are not treated as liabilities in the sense of debt securities, the market value of corporations is needed to be added. This is line 13 in Table B.1.

There is one complication however. Even though equities is not treated as liabilities, that held by foreigners is treated as liabilities. Otherwise, one can have a source of inconsistency. Suppose equities held by a non-resident economic units is not treated as liabilities. Suppose foreigners sell $1bn of equities and purchase T-bills with that. This will mean that the net wealth reduces. Which doesn’t make sense. Hence, one is forced to treat foreigners’ equity holdings as liabilities. So the foreign aspect of the whole calculation is the same as as done in the SNA and one needs to include the net international investment position of the United States which is line 24. (minus $5.47 trillion).

So that basically summarizes the calculation of the United States net wealth as per the Federal Reserve flow of funds report.

How does this compare with the SNA measurement? Some tables in the report are only updated to 2014. So let’s use those numbers.

Flow of funds’ net wealth for 2014 = $77.89 tn (Table B.1, line 1).

Now, go to Table S.2.a. These tables use SNA definitions. Add lines 76-81.

This gives us a value of $87.34 trillion.

However the Z.1 report has an error in the way SNA/IMA way of calculating net worth. Line 77 in Table S.2.a is incorrect. There’s double counting. It uses the SNA/IMA concept of net worth but instead calculates it using the FoF concept. One should subtract line 29 in table B.101 which is $10.04 trillion. Hence the US net worth in the SNA definition is $87.34 trillion minus $10.04 trillion which is $77.30 trillion.

So in short, the net worth of the United States as per the flow of funds definition at the end of 2014 was $77.89 trillion and according to the SNA/IMA it was $77.30 trillion.

What does all this mean? Hmm. Not to easy to answer, except saying that familiarity with the system of measurement helps in understanding how the economy works. Which measurement is better – the new table B.1 or S.2.a? Doesn’t matter.

I am thankful to commenters in this blog post by Steve Randy Waldman, especially JKH and Marko.

Part 2 here United States’ Net Wealth, Part 2

Click Bait Monetary Economics

Some economic commentators, in trying to point out the importance of government deficits and debt, go for the overkill.

Exhibit:

Sorry for picking Steve Roth, who is generally a nice person. But this is counterproductive. If you see the comments below, a commentator who claims to be a trained accountant also agrees with Steve Roth. The bait involves saying that this argument is “technically right”. It can be technically right for several reasons but outright misleading and commentators should stop doing this. So it could be true because the act of bank loan making itself creates an asset and liability equally, so there is no increase in net assets of either households or the private sector as a whole by just one transaction. But this is not just the argument. The argument seems to be that it doesn’t increase household net worth at all even if another transaction is involved, such as a house purchase because a firm sells the house not a household and in national accounts firms are distinct from households. So much click baiting.

In this post, I show how a household’s net worth rises on sale of a house. Let’s assume that I (Household 2) am a sole proprietor of a house building firm (Firm P) and hence the ownership of the firm is not publicly traded in a stock exchange. Suppose I sell a house worth $1mn to you (Household 1). The house is sold from my firm’s inventory of houses and becomes a sale. You buy this after taking a loan from Bank A.

Now, we need some good national accounting. A good way is to just pick up Wynne Godley’s stock-flow consistent models in which he values inventories at current cost of production. See Godley and Lavoie’s book Monetary Economics, Edition 1, page 29.

Let’s suppose the current cost of production is $400,000.

Now we need another concept: own funds at book value from the 2008 SNA, Paragraph 13.71d-e:

d. Book values reported by enterprises with macrolevel adjustments by the statistical compiler. For untraded equity, information on “own funds at book value” can be collected from enterprises, then adjusted with ratios based on suitable price indicators, such as prices of listed shares to book value in the same economy with similar operations. Alternately, assets that enterprises carry at cost (such as land, plant, equipment, and inventories) can be revalued to current period prices using suitable asset price indices.

e. Own funds at book value. This method for valuing equity uses the value of the enterprise recorded in the books of the direct investment enterprise, as the sum of (i) paid-up capital (excluding any shares on issue that the enterprise holds in itself and including share premium accounts); (ii) all types of reserves identified as equity in the enterprise’s balance sheet (including investment grants when accounting guidelines consider them company reserves); (iii) cumulated reinvested earnings; and (iv) holding gains or losses included in own funds in the accounts, whether as revaluation reserves or profits or losses. The more frequent the revaluation of assets and liabilities, the closer the approximation to market values. Data that are not revalued for several years may be a poor reflection of market values.

The accounting entries are simple (I am considering increases/decreases here, so “= +” is understood as an increase in the thing on its left.)

For Household 1:

Assets

Liabilities and Net Worth

House = +$1mn

Bank Loan = +$1mn
Net Worth = +$0

For Bank A:

Assets

Liabilities and Net Worth

Loan to Household 1 = +$1mn

Deposits of Firm P = +$1mn
Net Worth = +$0

For Firm P:

Assets

Liabilities and Net Worth

Deposits = +$1mn
Inventories = −$0.4mn

Own Funds = +$0.6mn
Net Worth = +$0

For Household 2:

Assets

Liabilities and Net Worth

Own Funds at Firm P = +$0.6mn

Net Worth = +$0.6mn

So, my (Household 2’s) net worth has risen by $600,000 by selling you (Household 1) a house.

I have in this example, intentionally chosen a privately owned firm to score a point. If the firm had been publicly owned, the house sale would have increase the firm’s net worth and my (Household 2’s) net worth would increase when the firm’s net worth reflects in the share price (which is not immediate). But I just had to show one example. It’s not just academic – many firms are family owned.

Steve Roth’s claim are similar to claim made by Neochartalists who claim that the private sector can only save if the government runs deficits and so on. All counterproductive.

The case for fiscal expansion can be made quite strongly, but not by these click bait claims.