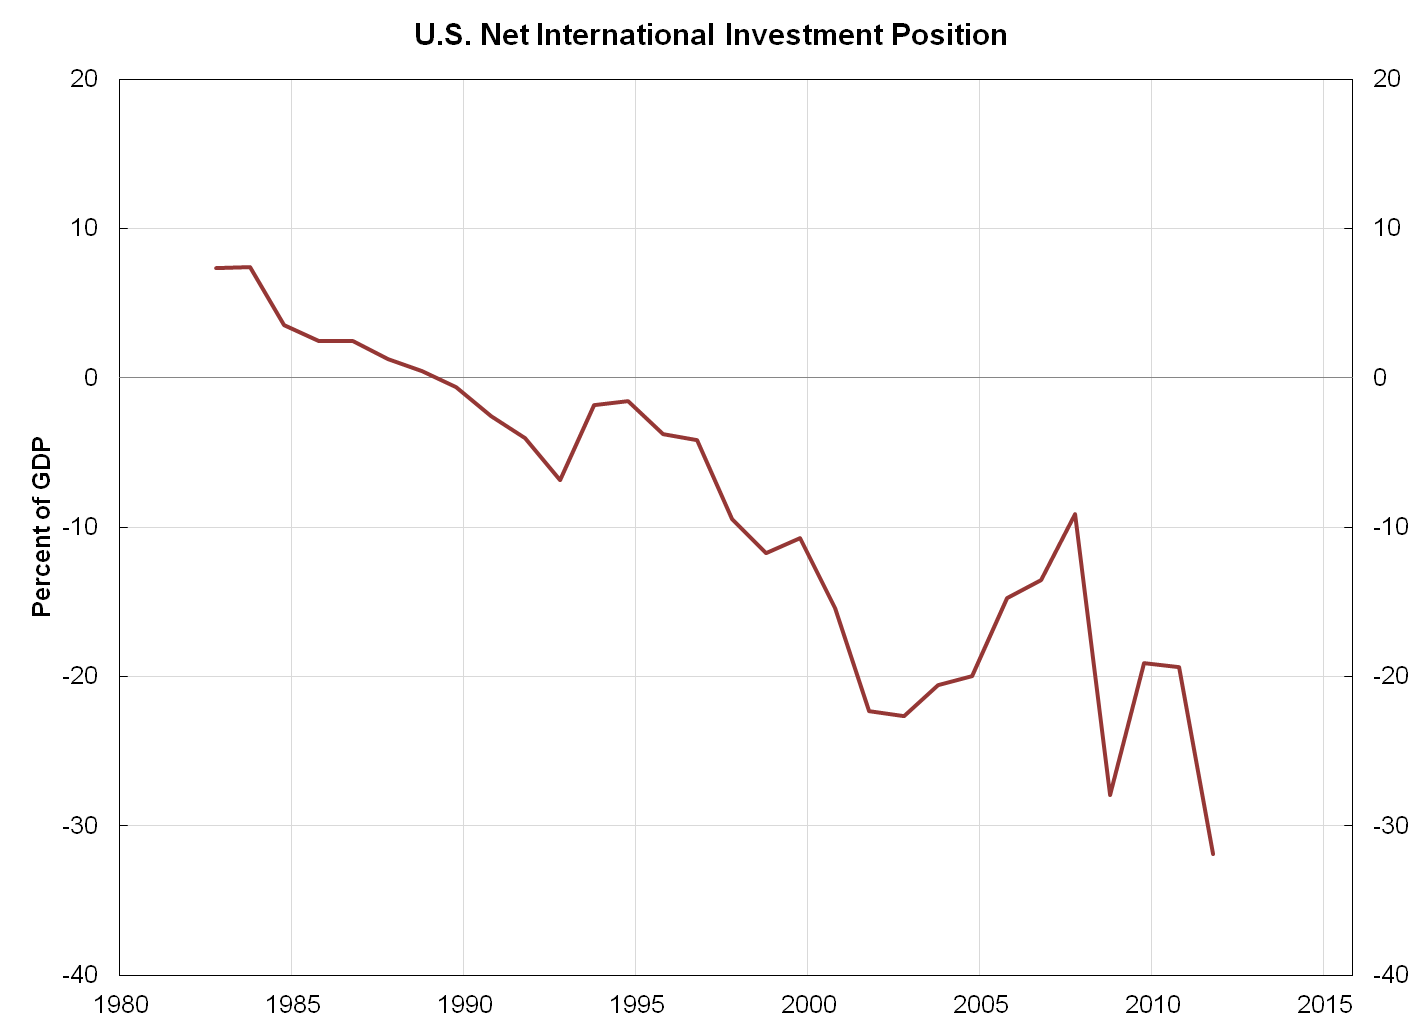
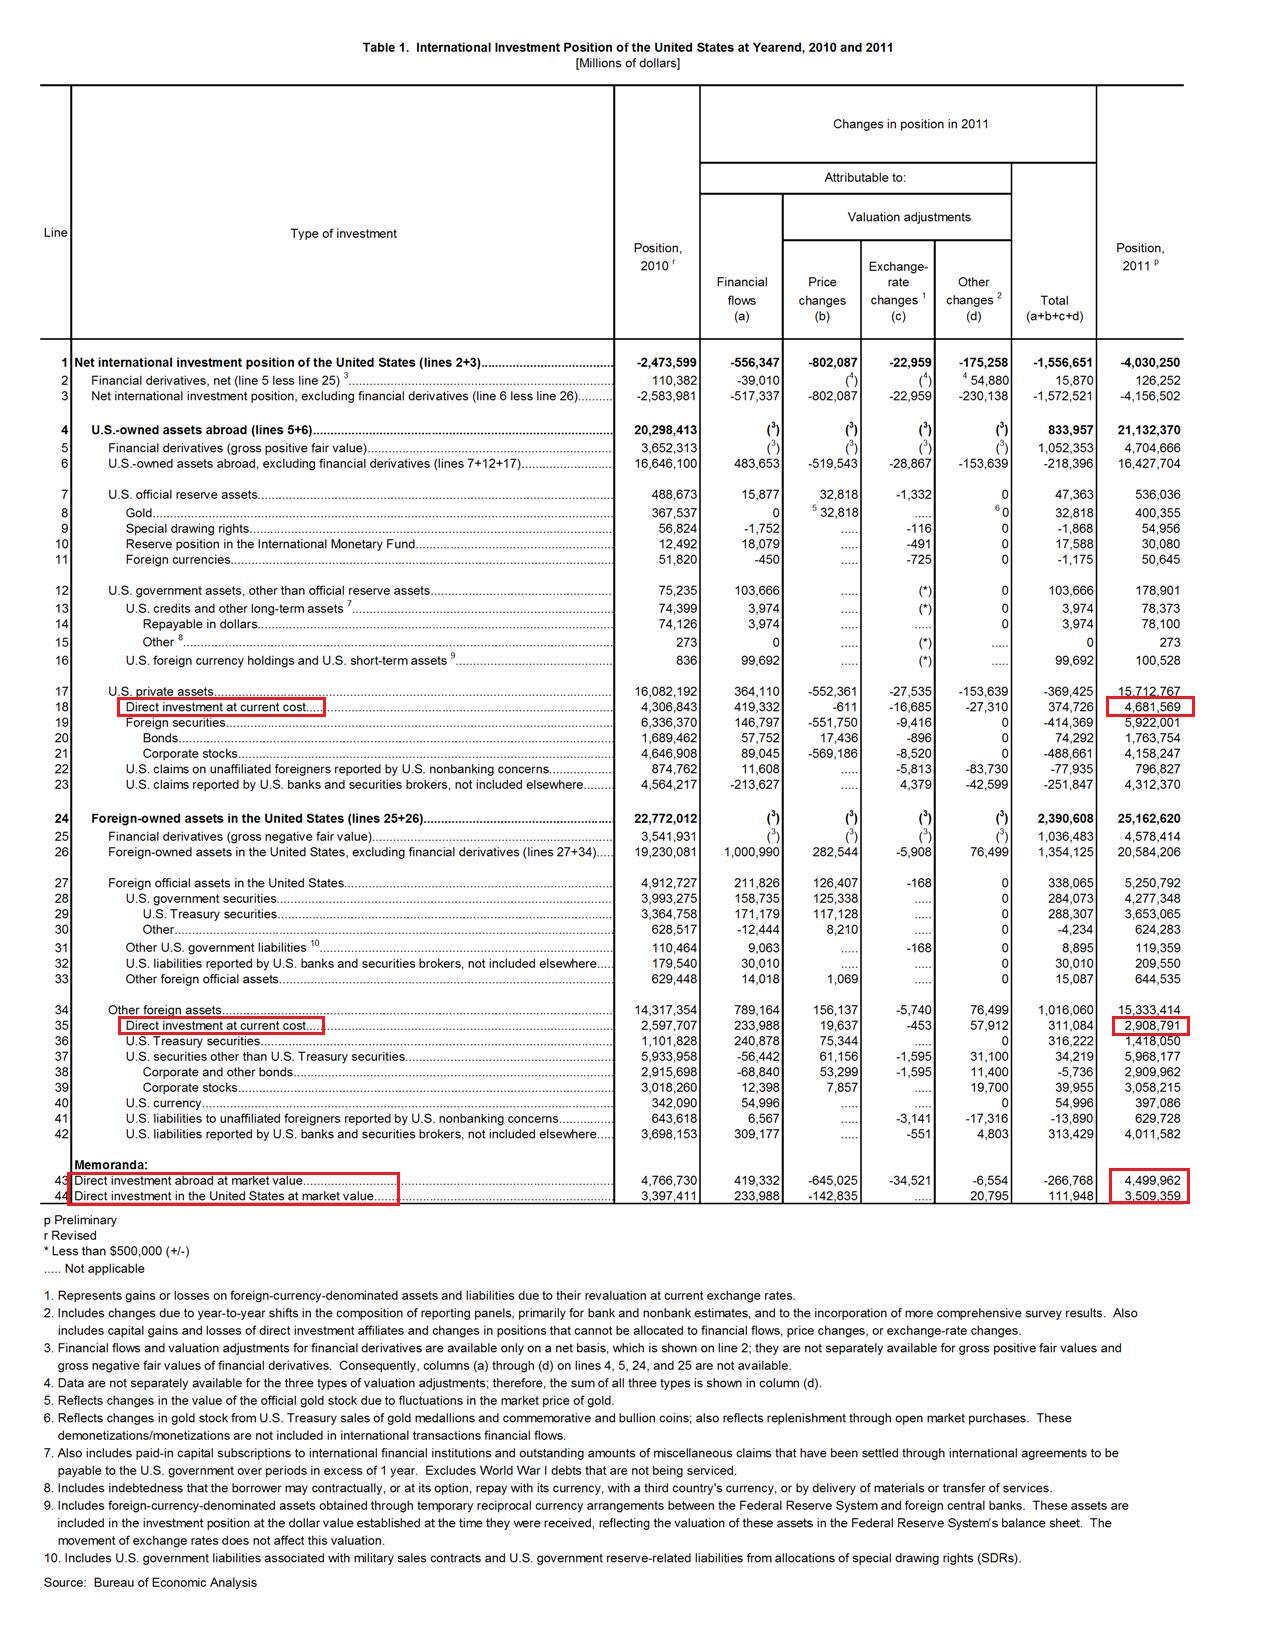
The BEA reported yesterday that the U.S. Net International Investment Position at the end of 2011 was minus $4,030.3bn. The large change compared to the end of 2010 (where it was -$2,473.6bn) was due to large revaluations of assets and liabilities in addition to the current account deficit. See the BEA blog on this.
For IIP, Foreign Direct Investments are measured at “current costs”. When evaluated at market prices, the net international investment position at the end of 2011 would have been minus $4,812.4bn. The NIIP also includes official gold holdings and if this is excluded, the net indebtedness is greater than $5T.
The following is the NIIP as a percent of GDP at market prices.
There are several reasons this by itself hasn’t worked against the U.S. The U.S. dollar is the reserve currency of the world* and secondly direct investments make huge returns for the U.S. (It should still be noted that the current account deficits bleed demand in the U.S. at a massive scale). Direct investment abroad at the end of 2011 was about $4.5tn and foreign direct investment by nonresidents in the United States $3.5T.
U.S. International Investment Position
(click to enlarge)
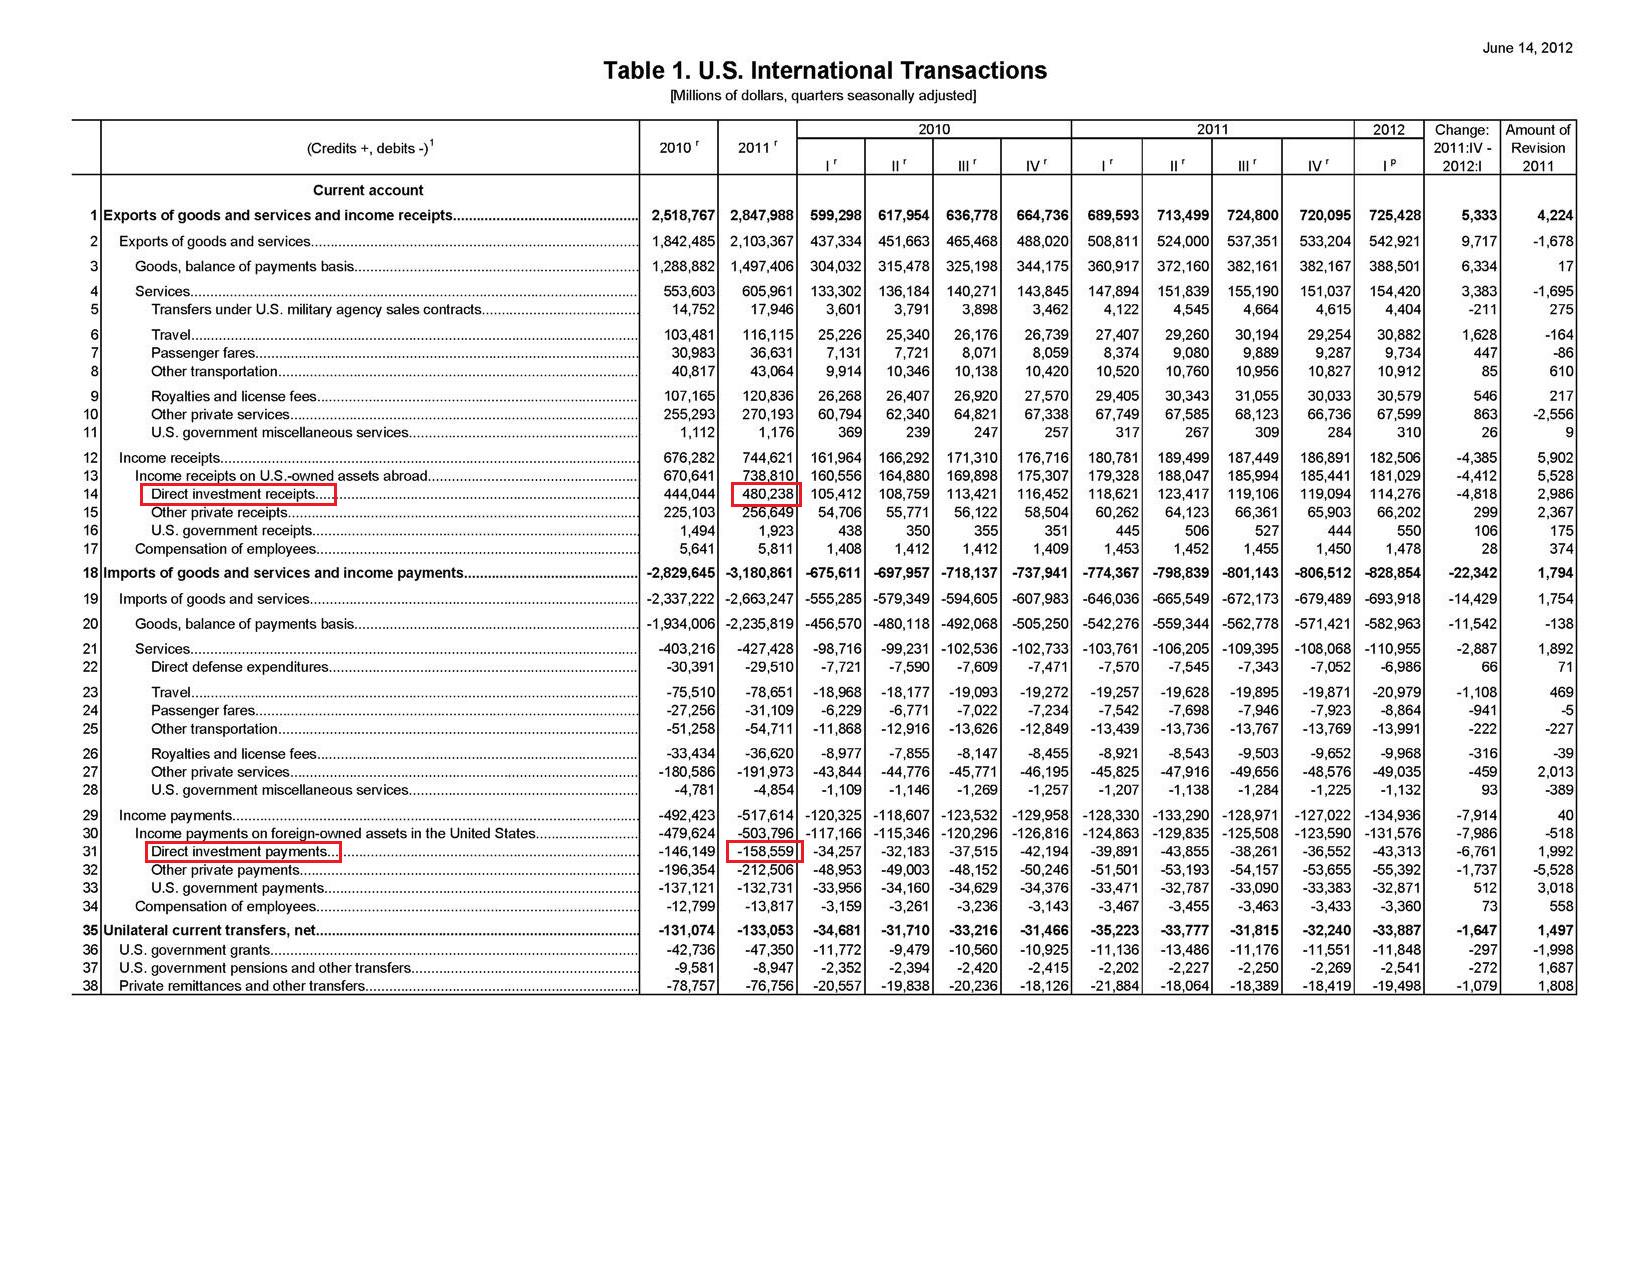
The direct investment abroad makes a huge killing for the U.S. as can be seen from the balance of payments. In 2011, direct investment receipts was around $480bn and direct investment payments only $159bn.
U.S. Current Balance of Payments
(click to enlarge)
*non-direct investment income is already against the United States’ favour though.


