In a recent post, I went into what is called the Transactions Flow Matrix. This is used heavily in Stock-Flow Consistent Modeling of the whole economy. The underlying theme is “everything comes from somewhere and goes somewhere, and there are no black holes”.
I also mentioned about a Balance Sheet Matrix. What is it?
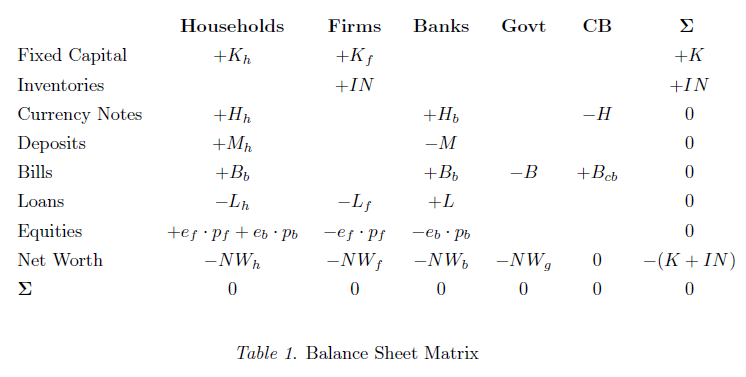
Sectors in an economy have assets and liabilities. Assets can be both financial as well as nonfinancial. Since nonfinancial assets are nobody’s liability, liabilities are financial. Very quickly, a balance sheet matrix is created by assigning a + sign to assets and a (-) sign to liabilities.
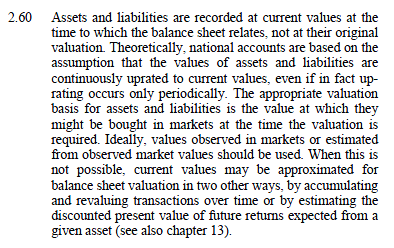
As per the System of National Accounts, all assets and liabilities are to be evaluated at market prices. According to 2008 SNA,
So a corporation or the government may have issued bonds at $100 but since the value fluctuates everyday and even during the day, it is possible that the bond price may reach $103. If it is the last day of the period for which the balance sheet is compiled, then the liability should be entered as $103, not $100.
We will have more to see in another post but let us just have a cursory look at an item called net worth. Since balance sheets should balance, we include this item in liabilities or rather call the right hand side of a balance sheet “Liabilities and Net Worth”. The term Net Worth has an intuitive appeal. If I have assets worth $100 and owe someone (say a bank) $10 and nothing more or less, my net worth is $90.
So let us quickly jump into the balance sheet matrix of a model economy.
In the previous post on the Transactions Flow Matrix, I had amalgamated the sectors Government and Central Bank into one, but now I have separated them so that there is higher clarity.
The reason I am writing this post is to stress the importance of signs. So in the above you will notice that households have a liability of L_{h} and hence appears with a negative sign. We shall see below however, that since loans are a source of funds, it will appear as a positive sign in the transactions flow matrix!
So households hold currency notes, deposits, bills and equities and these have counterpart in some other sector. And this should be the case because every financial asset is someone else’s liability. Also, from the matrix, the sum of net worths of all sectors (for a closed economy, at any rate) is equal to the value of the nonfinancial assets. This result isn’t surprising since financial assets cancel out with their counterpart liabilities.
We now jump to the transactions flow matrix – which I remade and added a lot of complications as compared to the previously related post The Transactions Flow Matrix
(Click to enlarge in a new tab)
These matrices are almost exactly similar to what appears in Wynne Godley and Marc Lavoie’s book Monetary Economics.
The difference between the two matrices is that the balance sheet matrix records assets and liabilities at the beginning or the end of a period, whereas the transactions flow matrix records transactions during an accounting period.
In the previous post I had briefly stressed the importance of signs but now we have the balance sheet matrix as well ready, let me stress this again using a few lines from G&L’s book on the transaction flow matrix (page 40):
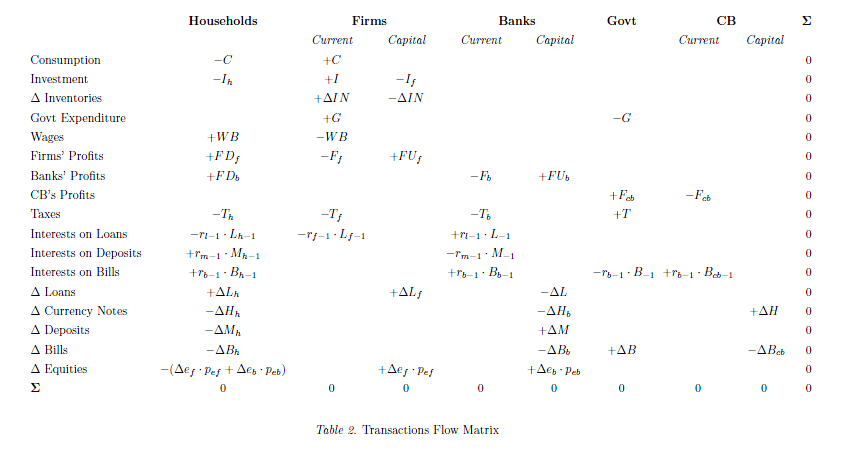
The best way to take it in is by first running down each column to ascertain that it is a comprehensive account of the sources and uses of all flows to and from the sector and then reading across each row to find the counterpart of each transaction by one sector in that of another. Note that all sources of funds in a sectoral account take a plus sign, while the uses of these funds take a minus sign. Any transaction involving an incoming flow, the proceeds of a sale or the receipts of some monetary flow, thus takes a positive sign; a transaction involving an outgoing flow must take a negative sign. Uses of funds, outlays, can be either the purchase of consumption goods or the purchase (or acquisition) of a financial asset. The signs attached to the ‘flow of funds’ entries which appear below the horizontal bold line are strongly counter-intuitive since the acquisition of a financial asset that would add to the existing stock of asset, say, money, by the household sector, is described with a negative sign. But all is made clear so soon as one recalls that this acquisition of money balances constitutes an outgoing transaction flow, that is, a use of funds.
So the government expenditure G has a minus sign because it is a use of funds and its sources are taxes, net issuance of bills and central bank profits.
The sources of funds for the production sector (abbreviated “firms”) is retained earnings (or undistributed profits, called FU), loans from banks and the issuance of equities and also sales (the consumption by households), government purchase of goods and investment itself because producers create tangible capital for themselves as a whole.
Now compare signs in the two matrices – equities are a source of funds for firms and hence has a positive sign in the transactions flow matrix but equities are also liabilities and hence the stock of equities appears with a negative sign in the balance sheet matrix.
Similarly, borrowing via loans are a source of funds for households and hence the positive sign in Table 2 while in Table 1 it appears with a minus sign.
For banks, making loans is a use of funds and taking deposits a source of funds. Hence minus and plus respectively in Table 2.
Also, the equities and loans in Table 2 are flows whereas in Table 1 they are stocks. Hence in Table 2, we have “Δ Loans” or change in loans, whereas in Table 1 its simply “Loans”.
Once we have a beginning of period balance sheet matrix and the transactions flow matrix, how do we construct the end of the period balance sheet matrix? I will leave this question for another post because I will have to introduce capital/holding gains and something called a full integration matrix. Before that I will have another post on real numbers taken from statistical releases to get more a intuitive feel for the balance sheet matrix.
The three matrices (the transactions flow matrix, the balance sheet matrix and the full integration matrix) go into the heart of “how money is created”. For this to be seen in detail, I will have to go into “monetary circuits” using transaction flows and that is the topic of yet another post. If you really understand how loans make deposits, the two tables should set you into a dynamical view of the whole process – a description completely different than the chimerical money multiplier model.


