Why is GDP defined as C+I+G+… and how is it related to national income, expenditure etc and that of each sector of an economy such as that of households?
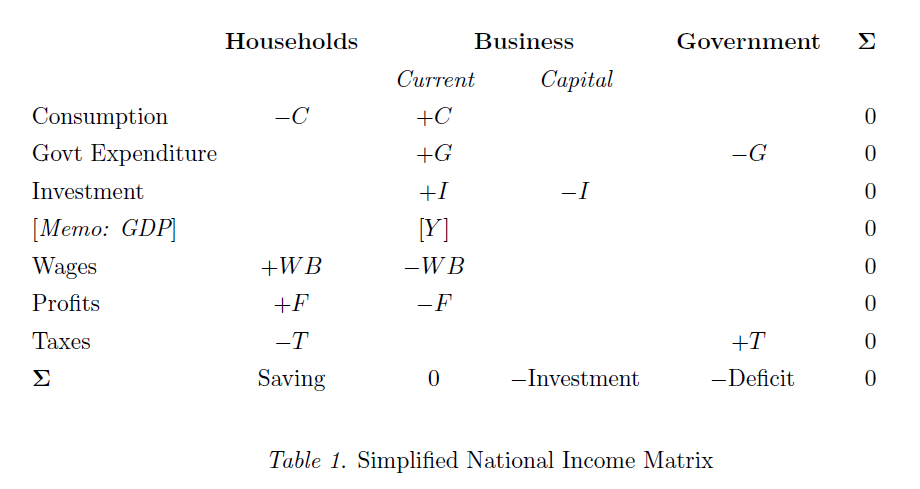
The following table (redrawn by myself) taken from the book Monetary Economics by Wynne Godley and Marc Lavoie gives an idea on how to go about measuring national income, product etc. The sample chapter (Contents, Chapter 1 & Index) from the publisher’s website has an introduction to the authors’ approach of studying Macroeconomics from a stock-flow consistent approach.
The table describes income and expenditures flows within an economy. Of course, as mentioned this is simplified and complications have to be added one by one. For example, there is no inventories, no external sector and households do not purchase a house etc. However, the above construction shows an easy way of building up and thinking about how funds flow between different ‘sectors’ of an economy. The reader who is new to this way of thinking should pay attention to the signs attached to each entry. For example, households receive wages and it is a source of funds for them and hence the positive sign. When they are consuming, they use funds and hence the first row in the table with the item consumption has a negative sign for households. For businesses, this a source of funds and hence positive. Another item which may be unfamiliar is the capital account of businesses. Firms purchase capital goods for their production and the sale of these goods comes from the same sector and hence one need for this column.
Even at this simplified form, there are a lot which are not known from the above table. What form does saving take? How does the government finance its excess of expenditure over income (i.e., deficit)? How do firms pay for wages and get funds to do the investment etc. To see this, we need a transactions flow matrix which I had discussed previously in my post Financial Crisis And Flow Of Funds from a not-so-pedagogic perspective. It is a foxy trick.
A few things before going into this. First notice that from the matrix,
C + I + G = Y = WB + F
So in our simplified example, gross domestic product is the sum of expenditures on goods and services and at the same time the sum of incomes paid for the production of goods and services.
Second, if you want the actual numbers (for the United States), the place to get this from the Federal Reserve Statistical Release Z.1. In particular, tables F.6 and F.7 and the hyperlink directly takes you to the table.
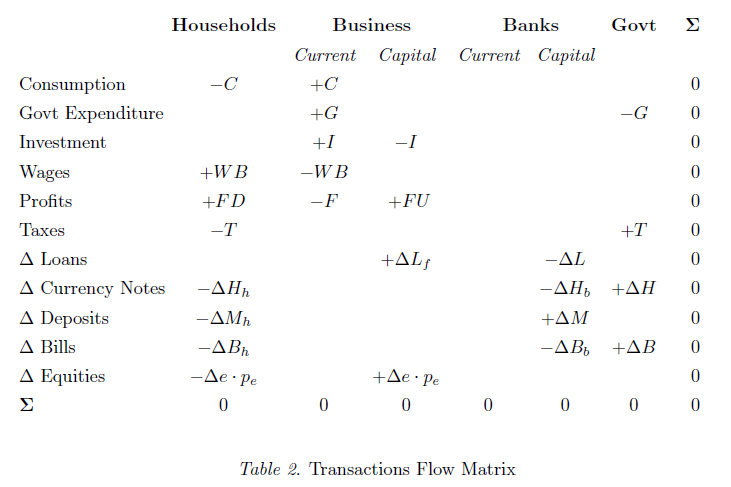
Back to our question on what form does saving take and how do firms finance their activities etc. Below is the table I made using TeX (and taken from the same book, Chapter 1)
The questions asked also lead us naturally to the introduction of the banking sector and its importance in the process of production, and this sector was missing in Table 1. So we can now clearly see what form saving takes. For households, this is in the form of currency notes, bank deposits, government T-bills and firms’ equities. Apart from various complications added, you may have noticed that profits are assumed to be part distributed and part retained. Firms hence finance investment by retained earnings, loans from banks and by issuance of equities, here. The government finances its deficit (i.e., excess of outlays over receipts) by issuing currency notes and T-bills. We have merged the Central Bank and the Federal Government into one sector “Govt”, for simplicity (which is also the case for Table 1). The behavioural aspects are something different and it should not be assumed that the government can “control” its deficit and that it can choose the proportion of financing in the form of currency notes and bills.
Needless to say, the above transactions flow matrix is a simplified one. For example, you may immediately notice that there is no interest payments on loans and bills yet.
It should be noted here that the entries in the table are flows and hence you may see a lot of Δs. The reader who is relatively new to this should not fail to observe the signs attaching each entry. The negative sign in the entry for deposits for households may be confusing at first, but the self-consistency of the whole construction forces the signs on these entries.
It is worth emphasizing that the fact that all rows and columns sum to zero and this makes the whole construction very appealing. When I was trying to get myself introduced to economics about 3 years back, I browsed around the internet and quickly came across the transactions flow matrix – exactly what I was looking for!
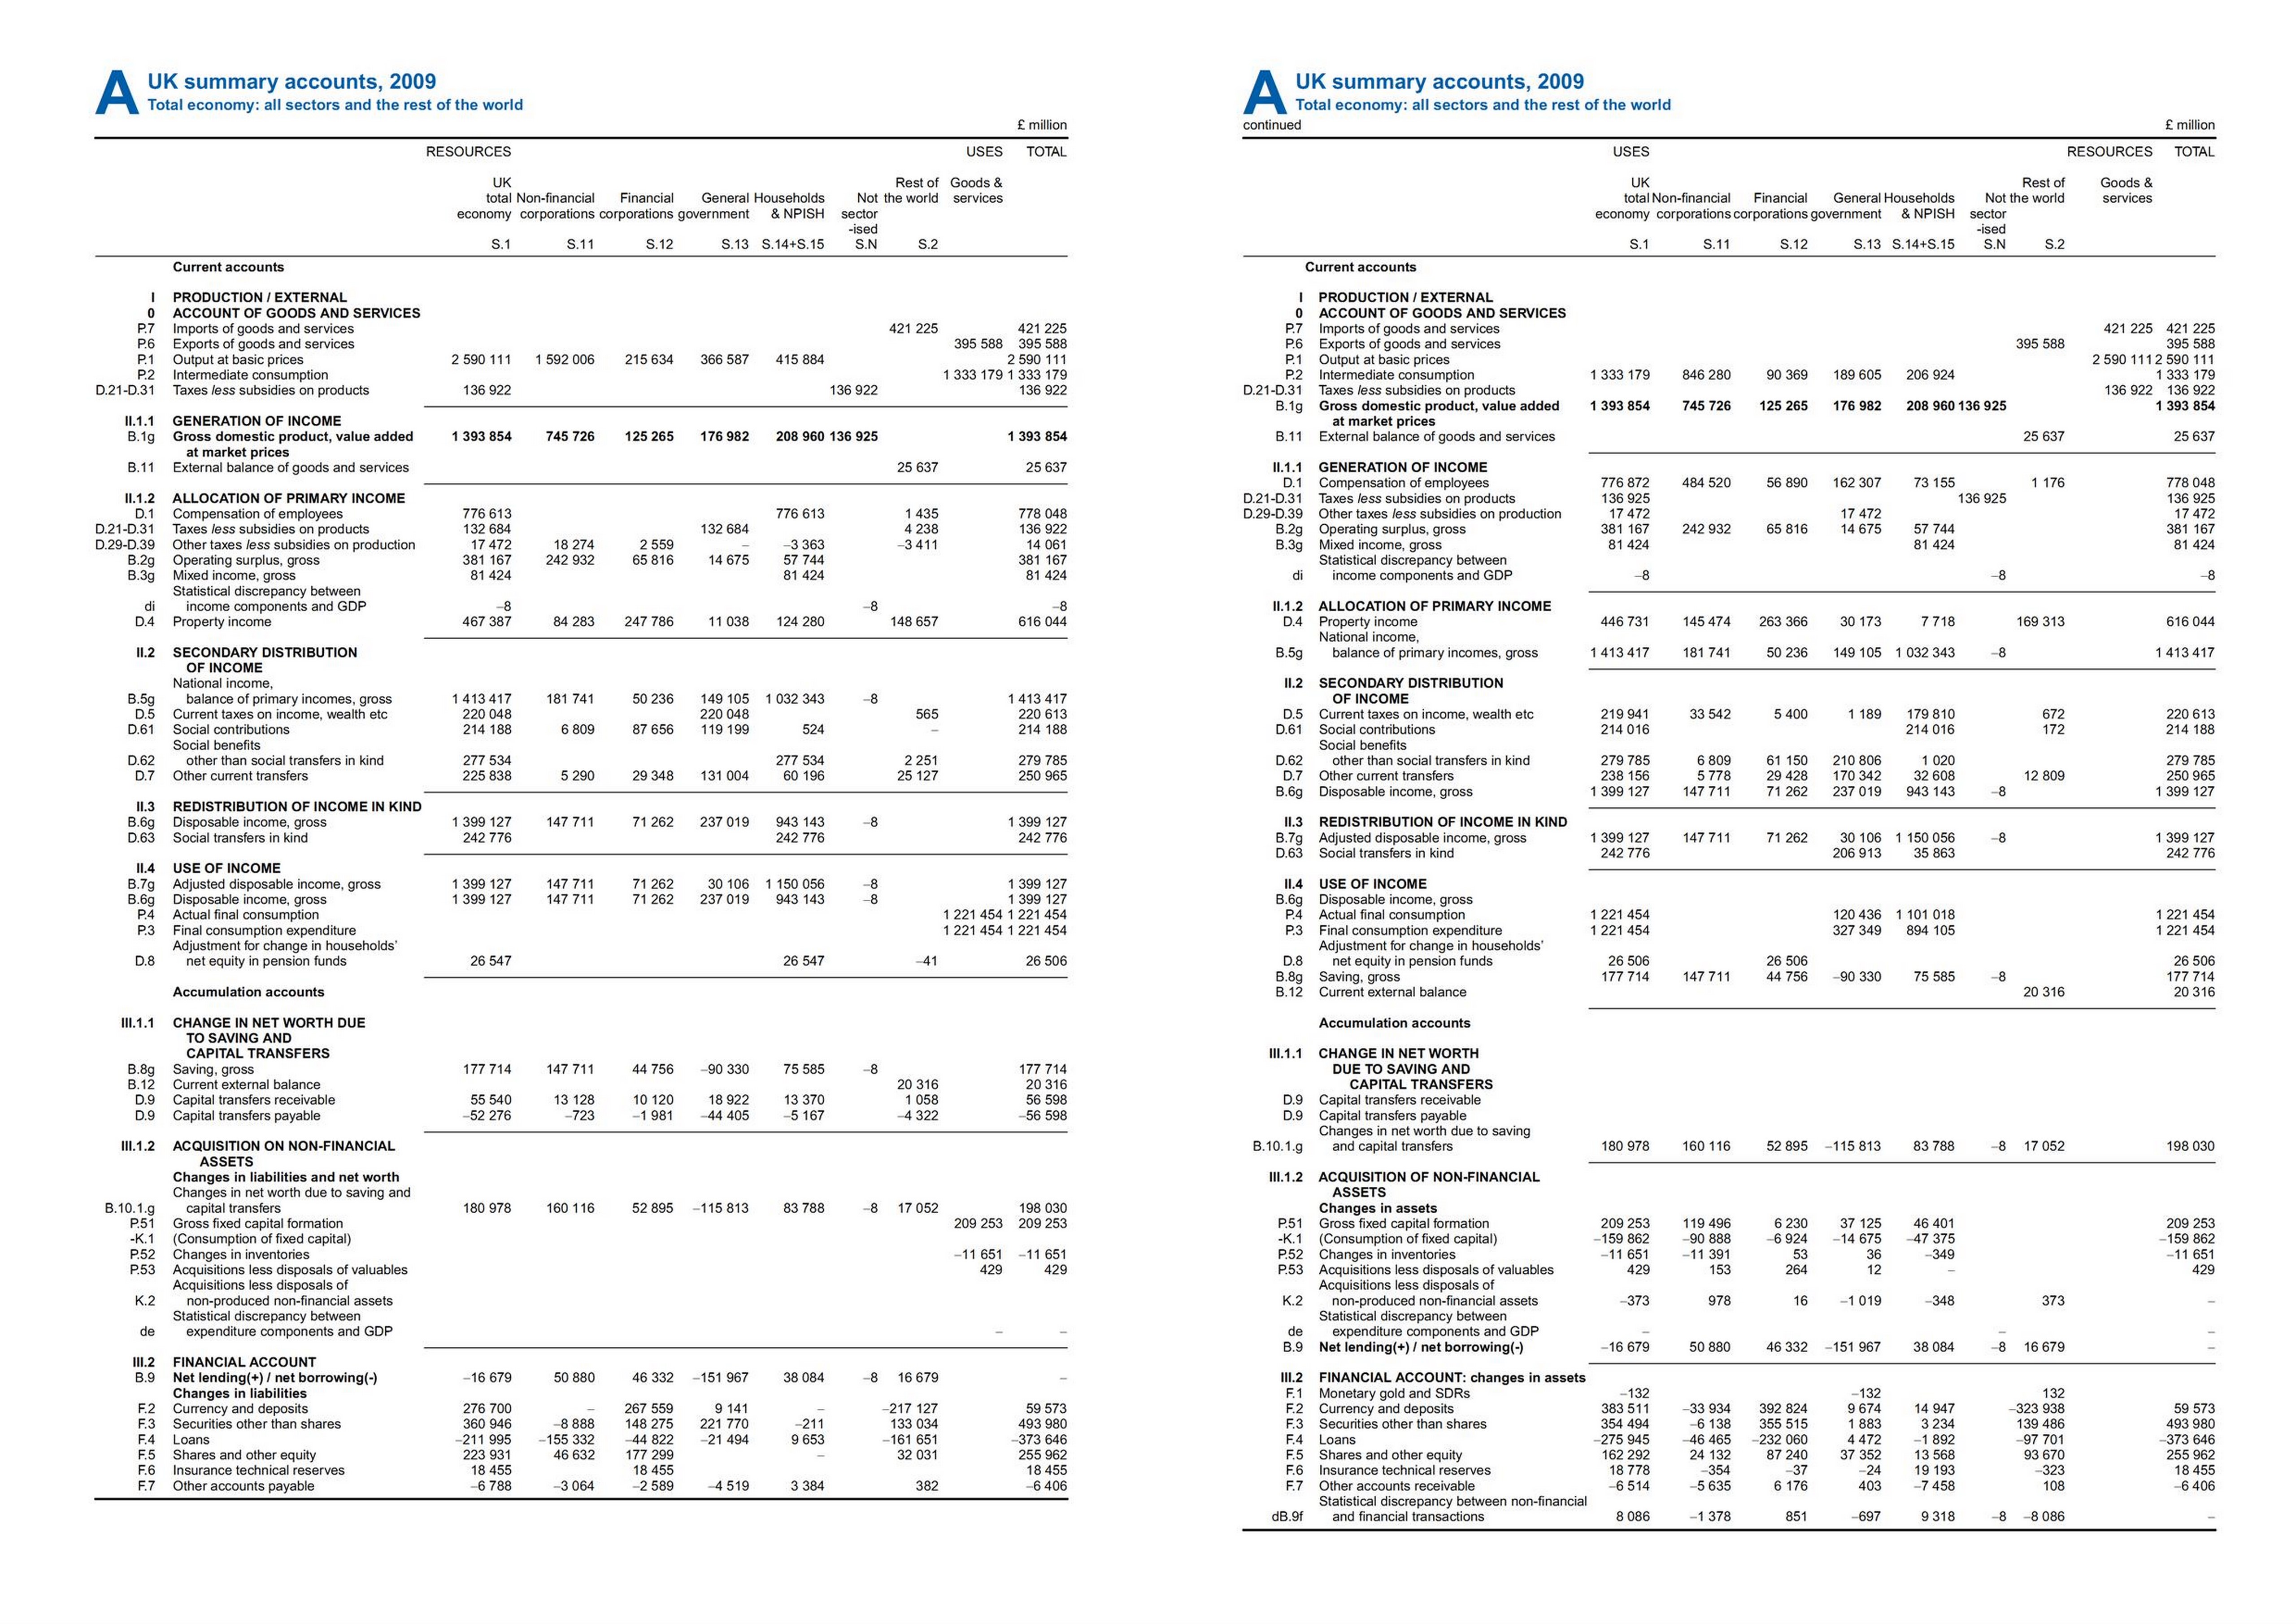
This construction greatly simplifies visualizing flow of funds as compared to the Blue Book way of doing it. The following is the 2008 SNA way of maintaining national accounts and there is some additional effort one needs to visualize this without the usage of a transactions flow matrix!
(click to enlarge)


